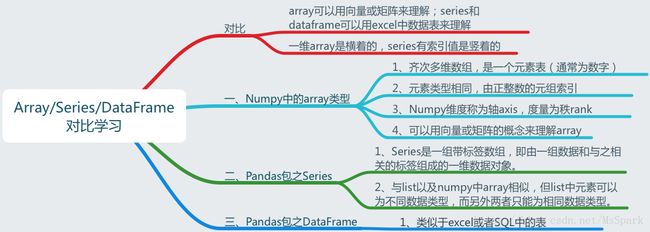
Pandas之DataFrame用法总结
DataFrame:类似于表的数据结构
通过与array以及series对比进行学习,会更清楚DataFrame的用法和特点。

本文对Pandas包中二维(多维)数据结构DataFrame的特点和用法进行了总结归纳。
可以参考:pandas用法速览

3.1 增加数据
3.1.1 创建数据框Object Creation
numpy.random.randn(m,n):是从标准正态分布中返回m行n列个样本中;
numpy.random.rand(m,n):是从[0,1)中随机返回m行n列个样本。
import pandas as pd
import numpy as np
#通过Numpy array来创建数据框
dates=pd.date_range('2018-09-01',periods=7)
dF1=pd.DataFrame(np.random.rand(7,4),index=dates) #从[0,1)中随机返回一个数组
>>>
		0		1		2		3
2018-09-01	0.445283	0.798458	0.818208	0.340356
2018-09-02	0.249172	0.535308	0.811825	0.224133
2018-09-03	0.466948	0.178802	0.997567	0.361670
2018-09-04	0.720670	0.407122	0.120310	0.180888
2018-09-05	0.545400	0.169919	0.171649	0.030347
2018-09-06	0.553405	0.013866	0.582740	0.030837
2018-09-07	0.185981	0.137448	0.817721	0.768875

#通过dict来创建数据框
dataDict={'A':1.,
          'B':pd.Timestamp('20180901'),
          'C':pd.Series(1,index=range(4),dtype='float'),
          'D':np.array([3]*4,dtype='int'),
          'E':pd.Categorical(['test','train','test','train']),
          'F':'foo'
         }
dF2=pd.DataFrame(dataDict)
>>>
	A	B		C	D	E	F
0	1.0	2018-09-01	1.0	3	test	foo
1	1.0	2018-09-01	1.0	3	train	foo
2	1.0	2018-09-01	1.0	3	test	foo
3	1.0	2018-09-01	1.0	3	train	foo
3.1.2 整合数据
Concat/Merge/Append
Concat:将数据框拼接在一起(可按rows或columns)
Merge:类似于SQL中Join的用法
Append:将数据按rows拼接到数据框中
#Concat:将数据框拼接在一起(可按rows或columns)
dF=pd.DataFrame(np.random.randn(10,4))
>>>

	0		1		2		3
0	-1.135930	-0.371505	0.349293	-2.788323
1	-0.505594	0.012753	0.539757	0.044460
2	1.208134	-0.436352	1.361564	-0.777053
3	-0.909025	0.929461	0.411863	0.866106
4	-0.300255	-0.023755	-1.382157	0.042096
5	0.335969	-0.176301	0.751841	-0.016906
6	0.545919	1.202155	0.705825	-2.305620
7	-0.820600	-2.588532	-0.475357	0.475708
8	-0.097844	0.141700	0.322873	0.586568
9	0.941772	0.789850	-1.017382	-0.762623

#将数据框拆分后在拼接
pieces1=dF[:3]
>>>
	0		1		2		3
0	-1.135930	-0.371505	0.349293	-2.788323
1	-0.505594	0.012753	0.539757	0.044460
2	1.208134	-0.436352	1.361564	-0.777053

pieces2=dF[3:7]
pieces3=dF[7:]
pd.concat([pieces1,pieces2,pieces3],axis=0) #拼接
#Merge(类似于SQL中Join的用法)
left=pd.DataFrame({'key':['foo','foo'],'value':[1,2]})
>>>
	key	value
0	foo	1
1	foo	2

right=pd.DataFrame({'key':['foo','foo'],'value':[4,5]})
>>>
key	value
0	foo	4
1	foo	5

#根据key进行连接
pd.merge(left,right,on='key')
>>>
	key	value_x	value_y
0	foo	1	4
1	foo	1	5
2	foo	2	4
3	foo	2	5
Python中Merge()函数用法
#Append:将数据按rows拼接到数据框中
df=pd.DataFrame(np.random.randn(8,4),columns=['A','B','C','D']
                ,index=range(1,9))
>>>
	A		B		C		D
1	0.048111	-0.973745	0.150854	1.839696
2	-0.718782	-0.858483	0.824083	-1.042301
3	-1.197431	1.129919	-0.041504	0.457233
4	-1.273139	2.535986	-0.173237	-0.504907
5	-0.210177	-1.958532	-0.076133	-0.569886
6	0.706548	-1.267755	0.908618	-0.142500
7	1.977968	-0.273628	0.160981	-0.574506
8	-0.034995	0.375605	0.105764	0.317471

s=df.iloc[0] #提取第一行数据
>>>
A    0.048111
B   -0.973745
C    0.150854
D    1.839696
Name: 1, dtype: float64

df.append(s,ignore_index=False) #ignore_index若为Ture则插入数据后索引将更新,否则保持原有索引值
>>>
	A		B		C		D
1	-0.437891	-0.716900	-1.379668	-0.617532
2	-1.605923	-0.685957	1.093090	0.063530
3	0.673912	0.391528	-1.161709	-0.263566
4	0.360196	-0.392037	0.395013	-1.575099
5	1.521031	0.557268	1.443565	-1.098274
6	1.530103	-0.124313	-0.347624	-0.852735
7	-0.154532	-0.337005	0.536932	0.482449
8	-2.165410	-1.606653	0.079391	-0.013447
1	-0.437891	-0.716900	-1.379668	-0.617532
3.1.3 导入/导出数据Getting Data In/Out
Csv/Excel
#Csv
#导出为Csv文件,名称及位置(默认和notebook文件同一目录下)
df.to_csv('foo.csv')
#导入Csv文件(且不导出索引,index默认为True)
fileDf=df.read_csv('foo.csv',index=False)

#Excel
#导出为xlsx文件
df.to_excel('foo.xlsx',sheet_name='Sheet1')
#导入制定表的sheet数据
fileDf=pd.read_excel('Python数据/朝阳医院2018年销售数据.xlsx','Sheet1')
3.2 查看数据
3.2.1 查看数据Viewing Data
查看数据三部曲:
head():查看数据前几项,看数据长什么样
info():查看数据类型,以及数据缺失情况
descibe():查看数据描述统计性信息,数据大概分布情况)
#导入数据
fileDf=pd.read_excel('Python数据/朝阳医院2018年销售数据.xlsx','Sheet1')
#fileDf.head(n)  n代表显示前几行数据
fileDf.head()
fileDf.info()
fileDf.describe()
此外,可以分别用fileDf.shape和fileDf.dtypes来查看数据的维度和各字段数据的类型。(注意在调用的时候不带括号)
#数据转置
fileDf.T
#按指定属性值排序
fileDf.sort_values('销售数量',ascending=False) #按照‘销售数量’降序排列数据
#查看某数据数值的分布
fileDf['商品名称'].value_counts()  #查看各项数量
fileDf['商品名称'].value_counts(normalize=True)  #查看各项占比
Pandas中排序函数sort_values()用法
3.2.2 选取数据Selection
#直接切片获取数据(行根据位置,列根据列名)
fileDf['商品名称']  #根据属性名,获取列
fileDf[0:3] #切片获取位置(0:2)的数据,相当于fileDf.iloc[0:3]

#利用loc根据标签值Label获取数据:可以交叉取值
fileDf.loc[0:3,['商品名称','销售数量']] #获取索引值为(0:3)的中'商品名称'的数据
fileDf.loc[1] #获取索引值为2的所有数据

#利用iloc根据位置获取Position数据
fileDf.iloc[1] #获取第二行的所有数据
fileDf.iloc[1:3,[0,3]] #获取第二、三行,一、四列的数据

#利用布尔值判断取数
fileDf[fileDf['销售数量']>30] #提取“销售数量”大于30的数据

#isin()方法,类似于SQL中的in方法
fileDf[fileDf['商品名称'].isin(['感康'])] #提取“商品名称”为感康的所有数据

#提取“商品名称”为感康,且“销售数量”大于5的所有数据
fileDf[fileDf['商品名称'].isin(['感康'])&(fileDf['销售数量']>5)]
3.2.3 数据操作Operations
stats/Apply
Apply:(用于dataframe,对row或column进行操作)类似于map(python自带,用于series,元素级别的操作)
#stats
fileDf.mean() #求均值
fileDf['实收金额'].mean() #求某列均值

#apply
df.apply(lambda x:x.max()-x.min())
3.2.4 分组操作Grouping
类似于SQL中的group by 分组操作
#根据商品名称进行分组求和,得到每种商品的'销售数量','应收金额','实收金额'
fileDf.groupby('商品名称').sum()[['销售数量','应收金额','实收金额']]
#根据时间和商品名称进行分组求和,得到每天每种商品的'销售数量','应收金额','实收金额'
fileDf.groupby(['购药时间','商品名称']).sum()[['销售数量','应收金额','实收金额']]
3.3 修改数据
3.3.1 缺失值处理Missing Data
pandas中主要用np.nan来代表缺失值(NaN),缺失值一般不进行计算操作
#剔除有缺失值的行
fileDf.dropna(how='any')
#填充缺失值
fileDf.fillna(value=5) #用特定值填充
#找出‘商品名称’中有空缺值的行
fileDf[fileDf['商品名称'].isnull()]
3.3.2 改变形状Reshaping
Pivot Tables:类似excel中的数据透视表,重新组合行和列
#利用字典创建数据框
df=pd.DataFrame({'A':['one','one','two','three']*3,
                'B':['A','B','C']*4,
                'C':['foo','foo','foo','bar','bar','bar']*2,
                'D':np.random.randn(12),
                'E':np.random.randint(0,5,12)}
)
print(df)
>>>
	A  B    C   D  E
0     one  A  foo -0.616543  4
1     one  B  foo -0.146041  1
2     two  C  foo -0.562578  4
3   three  A  bar -0.299173  0
4     one  B  bar -0.550978  1
5     one  C  bar -0.150658  1
6     two  A  foo  1.598310  3
7   three  B  foo  1.588566  2
8     one  C  foo  0.414795  0
9     one  A  bar  0.901496  3
10    two  B  bar  0.326600  0
11  three  C  bar -2.296521  0

#分析D数据在A/B/C属性不同时的值
pd.pivot_table(df,values='D',index=['A','B'],columns=['C'])
>>>
	C	bar			foo
A	B
one	A	0.901496	-0.616543
	B	-0.550978	-0.146041
	C	-0.150658	0.414795
three A	-0.299173	NaN
	B	NaN			1.588566
	C	-2.296521	NaN
two	A	NaN			1.598310
	B	0.326600	NaN
	C	NaN			-0.562578
重塑和轴转向:
stack:将数据的列“旋转”为行
unstack:将数据的行“旋转”为列
3.3.3 修改指定列中数据
需要先用loc将数据提取出来,再赋值修改;
若需修改索引,可直接赋值df.index=##;
若需修改列名,可直接赋值df.columns=##。
#利用字典创建数据框
df=pd.DataFrame({'A':['one','one','two','three']*3,
                'B':['A','B','C']*4,
                'C':['foo','foo','foo','bar','bar','bar']*2,
                'D':np.random.randn(12),
                'E':np.random.randint(0,5,12)}
)
print(df)
>>>
        A  B    C         D  E
0     one  A  foo -0.362885  0
1     one  B  foo  0.185367  2
2     two  C  foo  0.487103  4
3   three  A  bar -0.724691  4
4     one  B  bar -1.725003  4
5     one  C  bar -0.011432  3
6     two  A  foo -0.471946  3
7   three  B  foo -0.057156  0
8     one  C  foo -0.220240  2
9     one  A  bar  0.687409  0
10    two  B  bar -0.640526  2
11  three  C  bar  0.900257  4

#将A列为“one”,C列为“bar”的E列数据修改为110
df.loc[(df['A']=='one')&(df['C']=='bar'),'E']=110
print(df)
>>>
        A  B    C         D    E
0     one  A  foo -0.362885    0
1     one  B  foo  0.185367    2
2     two  C  foo  0.487103    4
3   three  A  bar -0.724691    4
4     one  B  bar -1.725003  110
5     one  C  bar -0.011432  110
6     two  A  foo -0.471946    3
7   three  B  foo -0.057156    0
8     one  C  foo -0.220240    2
9     one  A  bar  0.687409  110
10    two  B  bar -0.640526    2
11  three  C  bar  0.900257    4

#修改索引为1-12
df.index=range(1,13)
print(df)
>>>
        A  B    C         D  E
1     one  A  foo  1.752461  0
2     one  B  foo  0.050103  2
3     two  C  foo -0.238459  3
4   three  A  bar  0.036248  2
5     one  B  bar -1.482152  3
6     one  C  bar  0.842914  0
7     two  A  foo  0.610023  4
8   three  B  foo -0.323742  2
9     one  C  foo  2.806338  1
10    one  A  bar  1.251093  4
11    two  B  bar  0.391565  2
12  three  C  bar -0.322481  0

#修改列名为'EDCBA'
df.columns=['E','D','C','B','A']
print(df)
>>>
        E  D    C         B  A
1     one  A  foo  1.752461  0
2     one  B  foo  0.050103  2
3     two  C  foo -0.238459  3
4   three  A  bar  0.036248  2
5     one  B  bar -1.482152  3
6     one  C  bar  0.842914  0
7     two  A  foo  0.610023  4
8   three  B  foo -0.323742  2
9     one  C  foo  2.806338  1
10    one  A  bar  1.251093  4
11    two  B  bar  0.391565  2
12  three  C  bar -0.322481  0
3.4 时间序列Time Series
#创建间隔为1s总数10个时间序列
rng=pd.date_range('20180901',periods=10,freq='S')
>>>
DatetimeIndex(['2018-09-01 00:00:00', '2018-09-01 00:00:01',
               '2018-09-01 00:00:02', '2018-09-01 00:00:03',
               '2018-09-01 00:00:04', '2018-09-01 00:00:05',
               '2018-09-01 00:00:06', '2018-09-01 00:00:07',
               '2018-09-01 00:00:08', '2018-09-01 00:00:09'],
              dtype='datetime64[ns]', freq='S')

#以时间序列为索引值,创建Series
ts=pd.Series(np.random.randint(0,500,len(rng)),index=rng)
>>>
2018-09-01 00:00:00    249
2018-09-01 00:00:01    409
2018-09-01 00:00:02     85
2018-09-01 00:00:03     40
2018-09-01 00:00:04    157
2018-09-01 00:00:05    113
2018-09-01 00:00:06    152
2018-09-01 00:00:07    107
2018-09-01 00:00:08    259
2018-09-01 00:00:09    110
Freq: S, dtype: int64

#以1min为间隔进行求和
ts.resample('1Min').sum()
>>>
2018-09-01    1681
Freq: T, dtype: int64

#创建间隔为1天总数5个时间序列
rng=pd.date_range('9/1/2018 00:00',periods=5,freq='D')
>>>
DatetimeIndex(['2018-09-01', '2018-09-02', '2018-09-03', '2018-09-04',
               '2018-09-05'],
              dtype='datetime64[ns]', freq='D')

#以时间序列为索引值,创建Series
ts=pd.Series(np.random.randn(len(rng)),index=rng)
>>>
2018-09-01   -0.955735
2018-09-02    0.004711
2018-09-03   -2.177743
2018-09-04   -0.263494
2018-09-05   -1.760504
Freq: D, dtype: float64
如果对于本文中代码或数据有任何疑问,欢迎评论或私信交流
相近文章:
Numpy中Array用法总结
Pandas中Series用法总结