Chapter1_Hands-On ML with sklearn & TF
首先测试一下如何用python进行基本的数据处理,用的是pandas模块
import pandas as pd
import os
path=os.path.join("datasets","lifesat","")
path_oecd=path+"oecd_bli_2015.csv"
path_gdp=path+'gdp_per_capita.csv'
oecd_bli=pd.read_csv(path_oecd, thousands=',')
oecd_bli=oecd_bli[life_sat["INEQUALITY"]=="TOT"]
#此处已经将OECD数据的索引index设置为Country
oecd_bli=oecd_bli.pivot(index="Country",columns="Indicator",values="Value")
gdp_per_capita=pd.read_csv(path_gdp,thousands=',',delimiter='\t',encoding='latin1',na_values="n/a")
gdp_per_capita.rename(columns={"2015":"GDP per capita"},inplace=True)
#将GDP数据的索引也设置为Country
gdp_per_capita.set_index("Country",inplace=True)
#合并表格,根据索引值Country
full_country_stats=pd.merge(left=oecd_bli,right=gdp_per_capita,left_index=True,right_index=True)
full_country_stats.sort_values(by="GDP per capita",inplace=True)
#print(full_country_stats)
#print(full_country_stats['Life satisfaction'])
#print(full_country_stats[["GDP per capita","Life satisfaction"]])
TEST1:开始练习第一个简单的机器学习例子,预测GDP与生活满意度的关系
import os
path=os.path.join("datasets","lifesat","")
def prepare_country_stats(oecd_bli,gdp_per_capita):
    oecd_bli=oecd_bli[oecd_bli["INEQUALITY"]=="TOT"]
    oecd_bli=oecd_bli.pivot(index="Country",columns="Indicator",values="Value")
    gdp_per_capita.rename(columns={"2015":"GDP per capita"},inplace=True)
    gdp_per_capita.set_index("Country",inplace=True)
    full_country_stats=pd.merge(left=oecd_bli,right=gdp_per_capita,left_index=True,right_index=True)
    full_country_stats.sort_values(by="GDP per capita",inplace=True)
    remove_indices=[0,1,6,8,33,34,35]
    keep_indices=list(set(range(36))-set(remove_indices))
    #这里面为什么要用两个方括号?目前的理解是dataFrame的索引需要一个list作为输入,因此item=["GDP per capita","Life satisfaction"],full_country_stats[item]
    return full_country_stats[["GDP per capita","Life satisfaction"]].iloc[keep_indices]
import pandas as pd
import numpy as np
import matplotlib.pyplot as plt
import sklearn.linear_model
#load the data
path_oecd=path+"oecd_bli_2015.csv"
path_gdp=path+'gdp_per_capita.csv'
oecd_bli=pd.read_csv(path_oecd, thousands=',')
gdp_per_capita=pd.read_csv(path_gdp,thousands=',',delimiter='\t',encoding='latin1',na_values="n/a")
#prepare the data
country_stats=prepare_country_stats(oecd_bli,gdp_per_capita)
X=np.c_[country_stats["GDP per capita"]]
Y=np.c_[country_stats["Life satisfaction"]]
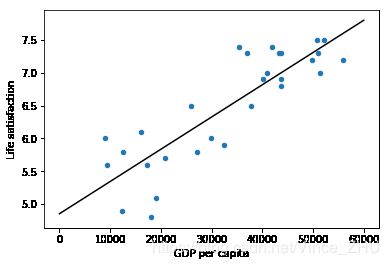
#Visualize the data
country_stats.plot(kind='scatter',x="GDP per capita",y="Life satisfaction")
#plt.show()
#select a linear model
model = sklearn.linear_model.LinearRegression()
#Train the model
model.fit(X,Y)
#Plot the model after training
b0,k0=model.intercept_[0],model.coef_[0]
x0=np.linspace(0,60000,500)
plt.plot(x0,b0+k0*x0,'k')
plt.show()
#Make a prediction for Cyprus
#如果只有一个方括号,或提示错误 ValueError: Expected 2D array, got 1D array instead:
#也是,一个方括号代表一维数组,两个方括号代表两维数组,那为什么要求两位数组呢?
X_new=[[22587]]
print(model.predict(X_new))
[[ 5.96242338]]
Summary:
机器学习的典型流程:
- 数据预处理,使其格式化;
- 数据特征研究;
- 根据数据特征选择合适的机器学习模型;
- 利用格式化的数据训练模型;
- 利用训练完成的模型进行数据预测。