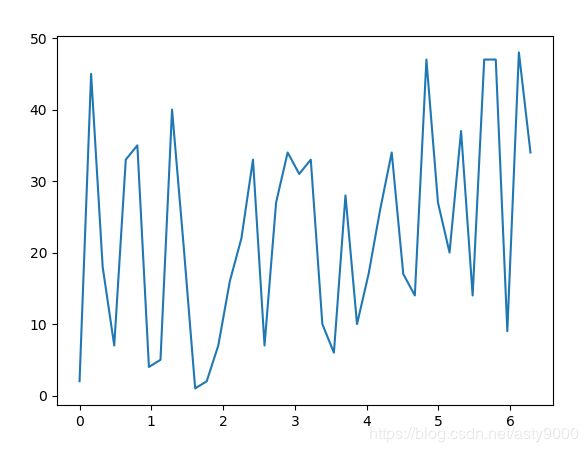
Python matplotlib绘制折线图简单实现
单条折线图
#coding=utf8
from matplotlib import pyplot as plt
import numpy as np
x = np.linspace(0, 2 * np.pi, 40)
y=np.random.randint(0,50,size = 40)
plt.plot(x,y)
plt.show()
运行结果:
多条折线图
#coding=utf8
from matplotlib import pyplot as plt
import numpy as np
x = np.linspace(0, 2 * np.pi, 40)
y1=np.random.randint(0,50,size = 40)
y2=np.random.randint(0,50,size = 40)
y3=np.random.randint(0,50,size = 40)
plt.plot(x,y1,label='y1')
plt.plot(x,y2,label='y2')
plt.plot(x,y3,label='y3')
plt.legend()
plt.show()
运行结果:

