matplotlib - 2D 与 3D 图的绘制(下)
一、3D 图
在matploylib中创建3d图,首先要做的是创建 Axes3D 类
from mpl_toolkits.mplot3d.axes3d import Axes3D
1. 绘制曲面
import matplotlib.pyplot as plt
from matplotlib import *
from numpy import *
from math import pi
from mpl_toolkits.mplot3d.axes3d import Axes3D
alpha = 0.7
phi_ext = 2 * pi * 0.5

def flux_qubit_potential(phi_m, phi_p):
    return 2 + alpha - 2 * cos(phi_p)*cos(phi_m) - alpha * cos(phi_ext - 2*phi_p)

phi_m = linspace(0, 2*pi, 100)
phi_p = linspace(0, 2*pi, 100)
X,Y = meshgrid(phi_p, phi_m)
Z = flux_qubit_potential(X, Y).T
fig = plt.figure(figsize=(14,6))

# `ax` is a 3D-aware axis instance because of the projection='3d' keyword argument to add_subplot
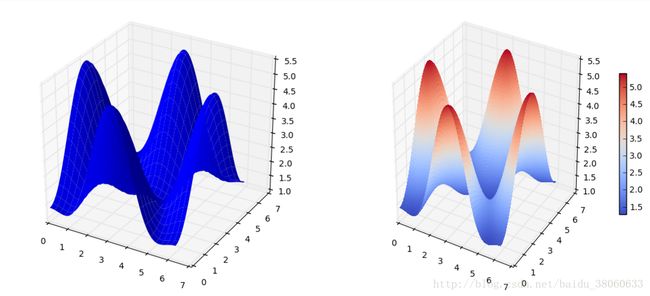
ax = fig.add_subplot(1, 2, 1, projection='3d')

p = ax.plot_surface(X, Y, Z, rstride=4, cstride=4, linewidth=0)

# surface_plot with color grading and color bar
ax = fig.add_subplot(1, 2, 2, projection='3d')
p = ax.plot_surface(X, Y, Z, rstride=1, cstride=1, cmap=cm.coolwarm, linewidth=0, antialiased=False)
cb = fig.colorbar(p, shrink=0.5)
fig
2. 绘制线框
fig = plt.figure(figsize=(8,6))

ax = fig.add_subplot(1, 1, 1, projection='3d')

p = ax.plot_wireframe(X, Y, Z, rstride=4, cstride=4)
fig
3. 绘制投影轮廓
fig = plt.figure(figsize=(8,6))

ax = fig.add_subplot(1,1,1, projection='3d')

ax.plot_surface(X, Y, Z, rstride=4, cstride=4, alpha=0.25)
cset = ax.contour(X, Y, Z, zdir='z', offset=-pi, cmap=cm.coolwarm)
cset = ax.contour(X, Y, Z, zdir='x', offset=-pi, cmap=cm.coolwarm)
cset = ax.contour(X, Y, Z, zdir='y', offset=3*pi, cmap=cm.coolwarm)

ax.set_xlim3d(-pi, 2*pi);
ax.set_ylim3d(0, 3*pi);
ax.set_zlim3d(-pi, 2*pi);
fig
4. 改变视图角度
view_init 可以改变视图角度,读取两个参数: elevation 与 azimuth 角度
fig = plt.figure(figsize=(12,6))

ax = fig.add_subplot(1,2,1, projection='3d')
ax.plot_surface(X, Y, Z, rstride=4, cstride=4, alpha=0.25)
ax.view_init(30, 45)

ax = fig.add_subplot(1,2,2, projection='3d')
ax.plot_surface(X, Y, Z, rstride=4, cstride=4, alpha=0.25)
ax.view_init(70, 30)

fig.tight_layout()
二、动画
FuncAnimation 函数能根据一系列图生成动画,它有以下参数:
fig:图的画布
func:更新图的函数
init_func:初始化图的函数
frame:图的数量
blit:告诉动画函数只更新改动的部分:
def init():
    # setup figure

def update(frame_counter):
    # update figure for new frame

anim = animation.FuncAnimation(fig, update, init_func=init, frames=200, blit=True)

anim.save('animation.mp4', fps=30) # fps = frames per second
为了使用动画特性,首先加载模块 matplotlib.animation:
from matplotlib import animation


# solve the ode problem of the double compound pendulum again

from scipy.integrate import odeint

g = 9.82; L = 0.5; m = 0.1

def dx(x, t):
    x1, x2, x3, x4 = x[0], x[1], x[2], x[3]

    dx1 = 6.0/(m*L**2) * (2 * x3 - 3 * cos(x1-x2) * x4)/(16 - 9 * cos(x1-x2)**2)
    dx2 = 6.0/(m*L**2) * (8 * x4 - 3 * cos(x1-x2) * x3)/(16 - 9 * cos(x1-x2)**2)
    dx3 = -0.5 * m * L**2 * ( dx1 * dx2 * sin(x1-x2) + 3 * (g/L) * sin(x1))
    dx4 = -0.5 * m * L**2 * (-dx1 * dx2 * sin(x1-x2) + (g/L) * sin(x2))
    return [dx1, dx2, dx3, dx4]

x0 = [pi/2, pi/2, 0, 0]  # initial state
t = linspace(0, 10, 250) # time coordinates
x = odeint(dx, x0, t)    # solve the ODE problem
生成双摆的运动动画:
fig, ax = plt.subplots(figsize=(5,5))

ax.set_ylim([-1.5, 0.5])
ax.set_xlim([1, -1])

pendulum1, = ax.plot([], [], color="red", lw=2)
pendulum2, = ax.plot([], [], color="blue", lw=2)

def init():
    pendulum1.set_data([], [])
    pendulum2.set_data([], [])

def update(n):
    # n = frame counter
    # calculate the positions of the pendulums
    x1 = + L * sin(x[n, 0])
    y1 = - L * cos(x[n, 0])
    x2 = x1 + L * sin(x[n, 1])
    y2 = y1 - L * cos(x[n, 1])

    # update the line data
    pendulum1.set_data([0 ,x1], [0 ,y1])
    pendulum2.set_data([x1,x2], [y1,y2])

anim = animation.FuncAnimation(fig, update, init_func=init, frames=len(t), blit=True)

# anim.save can be called in a few different ways, some which might or might not work
# on different platforms and with different versions of matplotlib and video encoders
#anim.save('animation.mp4', fps=20, extra_args=['-vcodec', 'libx264'], writer=animation.FFMpegWriter())
#anim.save('animation.mp4', fps=20, extra_args=['-vcodec', 'libx264'])
#anim.save('animation.mp4', fps=20, writer="ffmpeg", codec="libx264")
anim.save('animation.mp4', fps=20, writer="avconv", codec="libx264")

plt.close(fig)
为了生成动画,首先需要安装 libav-tools
sudo apt-get install libav-tools
运行:avplay animation.mp4
三、后端
Matplotlib 有很多用来渲染图片的后端:
print(matplotlib.rcsetup.all_backends)

['GTK', 'GTKAgg', 'GTKCairo', 'MacOSX', 'Qt4Agg', 'TkAgg', 'WX', 'WXAgg', 'CocoaAgg', 'GTK3Cairo', 'GTK3Agg', 'WebAgg', 'agg', 'cairo', 'emf', 'gdk', 'pdf', 'pgf', 'ps', 'svg', 'template']
默认后端是 agg,适合生成光栅图,比如 PNG。
一般情况都不用切换后端,但如果希望生成高清矢量图,可以切换成 PDF 或者 GTKCairo。
1. 使用 svg 后端生成 svg 图片
# RESTART THE NOTEBOOK: the matplotlib backend can only be selected before pylab is imported!
# (e.g. Kernel > Restart)

import matplotlib
matplotlib.use('svg')
import matplotlib.pylab as plt
import numpy
from IPython.display import Image, SVG

# Now we are using the svg backend to produce SVG vector graphics
fig, ax = plt.subplots()
t = numpy.linspace(0, 10, 100)
ax.plot(t, numpy.cos(t)*numpy.sin(t))
plt.savefig("test.svg")

# Show the produced SVG file.
SVG(filename="test.svg")
2. 可交互后端
使用可交互后端时需调用 plt.show() 才能使图片显示出来。
# RESTART THE NOTEBOOK: the matplotlib backend can only be selected before pylab is imported!
# (e.g. Kernel > Restart)

import matplotlib
matplotlib.use('Qt4Agg') # or for example MacOSX
import matplotlib.pylab as plt
import numpy

# Now, open an interactive plot window with the Qt4Agg backend
fig, ax = plt.subplots()
t = numpy.linspace(0, 10, 100)
ax.plot(t, numpy.cos(t)*numpy.sin(t))
plt.show()


