【机器学习】数据降维—核主成分分析(Kernel PCA)
本文代码推荐使用Jupyter notebook跑,这样得到的结果更为直观。
KPCA:将非线性可分的数据转换到一个适合对齐进行线性分类的新的低维子空间上。
非线性函数:
Φ为一个函数,能够对原始的特征进行非线性组合,将原始的d维数据集映射到更高的k维特征空间。
利用核PCA可以通过非线性映射将数据转换到一个高维空间中,在高维空间中使用PCA将其映射到另一个低维空间中,并通过线性分类器对样本对其划分。
此方法的缺点:高昂的计算成本
使用核技巧的原因:通过使用核技巧,我们可以在原始特征空间中计算两个高维特征空间中向量的相似度。
核函数:通过两个向量点积来度量向量间相似度的函数
常用核函数:
多项式核:
双曲正切核:
径向基核函数(RBF)(高斯核函数):

三个步骤实现RBF核的PCA:
1、 为了计算核(相似)矩阵k,需要计算任意两个样本之间的值
2、 对核矩阵进行聚集处理,使核矩阵k更为聚集
3、 将聚集后的核矩阵的特征值按照降序排列,选择前k个特征值所对应的特征向量,这里的向量不是主成分轴,而是将样本映射到这些轴上。
python实现核主成分分析:
使用scipy,NumPy实现核PCA方法。
from scipy.spatial.distance import pdist, squareform
from scipy import exp
from scipy.linalg import eigh
import numpy as np

def rbf_kernel_pca(X, gamma, n_components):
    """
    RBF kernel PCA 实现.

    Parameters
    ------------
    X: {NumPy ndarray}, shape = [n_samples, n_features]

    gamma: float
      RBF核的调优参数

    n_components: int
      要返回的主要组件的数量

    Returns
    ------------
     X_pc: {NumPy ndarray}, shape = [n_samples, k_features]
       Projected dataset

    """
    # 计算成对的欧几里得距离。
    #在MxN维数据集中
    sq_dists = pdist(X, 'sqeuclidean')

    # 将成对距离转换成方阵。
    mat_sq_dists = squareform(sq_dists)

    # 计算对称核矩阵。
    K = exp(-gamma * mat_sq_dists)

    # 中心核矩阵.
    N = K.shape[0]
    one_n = np.ones((N,N)) / N
    K = K - one_n.dot(K) - K.dot(one_n) + one_n.dot(K).dot(one_n)

    # 从中心核矩阵得到特征对。
    # numpy.eigh 按顺序返回它们
    eigvals, eigvecs = eigh(K)

    #收集顶级k特征向量(投影样本)
    X_pc = np.column_stack((eigvecs[:, -i]
                            for i in range(1, n_components + 1)))

    return X_pc
案例一:
# 分离半月形数据,实现rbf_kernel_pca方法应用于非线性数据集
# 创建一个包含100个样本的二维数据集,以两个半月形状表示
import matplotlib.pyplot as plt
%matplotlib inline
from sklearn.datasets import make_moons

X, y = make_moons(n_samples=100, random_state=123)

plt.scatter(X[y==0, 0], X[y==0, 1], color='red', marker='^', alpha=0.5)
plt.scatter(X[y==1, 0], X[y==1, 1], color='blue', marker='o', alpha=0.5)

plt.tight_layout()
# plt.savefig('./figures/half_moon_1.png', dpi=300)
plt.show()

由图可知,该数据集为非线性可分。
通过核PCA将该数据集展开,使得数据集成为适用于某一线性分类器的输入数据。
# 通过标准的PCA将数据映射到主成分上,对比原图
from sklearn.decomposition import PCA
from sklearn.preprocessing import StandardScaler

scikit_pca = PCA(n_components=2)
X_spca = scikit_pca.fit_transform(X)

fig, ax = plt.subplots(nrows=1,ncols=2, figsize=(7,3))

ax[0].scatter(X_spca[y==0, 0], X_spca[y==0, 1],
            color='red', marker='^', alpha=0.5)
ax[0].scatter(X_spca[y==1, 0], X_spca[y==1, 1],
            color='blue', marker='o', alpha=0.5)

ax[1].scatter(X_spca[y==0, 0], np.zeros((50,1))+0.02,
            color='red', marker='^', alpha=0.5)
ax[1].scatter(X_spca[y==1, 0], np.zeros((50,1))-0.02,
            color='blue', marker='o', alpha=0.5)

ax[0].set_xlabel('PC1')
ax[0].set_ylabel('PC2')
ax[1].set_ylim([-1, 1])
ax[1].set_yticks([])
ax[1].set_xlabel('PC1')

plt.tight_layout()
# plt.savefig('./figures/half_moon_2.png', dpi=300)
plt.show()

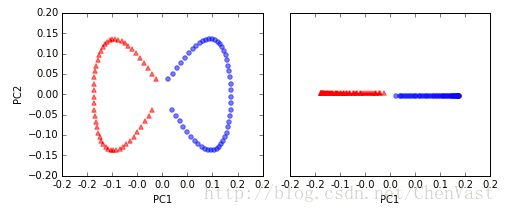
经过标准PCA的转换后,线性分类器未必能很好的发挥其作用。
# 使用核PCA函数rbf_kernel_pca
from matplotlib.ticker import FormatStrFormatter

X_kpca = rbf_kernel_pca(X, gamma=15, n_components=2)

fig, ax = plt.subplots(nrows=1,ncols=2, figsize=(7,3))
ax[0].scatter(X_kpca[y==0, 0], X_kpca[y==0, 1],
            color='red', marker='^', alpha=0.5)
ax[0].scatter(X_kpca[y==1, 0], X_kpca[y==1, 1],
            color='blue', marker='o', alpha=0.5)

ax[1].scatter(X_kpca[y==0, 0], np.zeros((50,1))+0.02,
            color='red', marker='^', alpha=0.5)
ax[1].scatter(X_kpca[y==1, 0], np.zeros((50,1))-0.02,
            color='blue', marker='o', alpha=0.5)

ax[0].set_xlabel('PC1')
ax[0].set_ylabel('PC2')
ax[1].set_ylim([-1, 1])
ax[1].set_yticks([])
ax[1].set_xlabel('PC1')
ax[0].xaxis.set_major_formatter(FormatStrFormatter('%0.1f'))
ax[1].xaxis.set_major_formatter(FormatStrFormatter('%0.1f'))

plt.tight_layout()
# plt.savefig('./figures/half_moon_3.png', dpi=300)
plt.show()

两个类别此时是线性可分的,使得数据适合成为线性分类器的训练集
对于可调参数γ,没有一个通用的值,只能具体问题具体调整。
案例二:
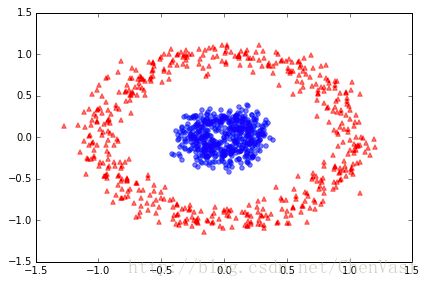
# 分离同心圆
from sklearn.datasets import make_circles

X, y = make_circles(n_samples=1000, random_state=123, noise=0.1, factor=0.2)

plt.scatter(X[y==0, 0], X[y==0, 1], color='red', marker='^', alpha=0.5)
plt.scatter(X[y==1, 0], X[y==1, 1], color='blue', marker='o', alpha=0.5)

plt.tight_layout()
# plt.savefig('./figures/circles_1.png', dpi=300)
plt.show()

# 使用标准PCA方法,对比原图
scikit_pca = PCA(n_components=2)
X_spca = scikit_pca.fit_transform(X)

fig, ax = plt.subplots(nrows=1,ncols=2, figsize=(7,3))

ax[0].scatter(X_spca[y==0, 0], X_spca[y==0, 1],
            color='red', marker='^', alpha=0.5)
ax[0].scatter(X_spca[y==1, 0], X_spca[y==1, 1],
            color='blue', marker='o', alpha=0.5)

ax[1].scatter(X_spca[y==0, 0], np.zeros((500,1))+0.02,
            color='red', marker='^', alpha=0.5)
ax[1].scatter(X_spca[y==1, 0], np.zeros((500,1))-0.02,
            color='blue', marker='o', alpha=0.5)

ax[0].set_xlabel('PC1')
ax[0].set_ylabel('PC2')
ax[1].set_ylim([-1, 1])
ax[1].set_yticks([])
ax[1].set_xlabel('PC1')

plt.tight_layout()
# plt.savefig('./figures/circles_2.png', dpi=300)
plt.show()

# 给定一个合适的γ值,基于RBF的核PCA实现
X_kpca = rbf_kernel_pca(X, gamma=15, n_components=2)

fig, ax = plt.subplots(nrows=1,ncols=2, figsize=(7,3))
ax[0].scatter(X_kpca[y==0, 0], X_kpca[y==0, 1],
            color='red', marker='^', alpha=0.5)
ax[0].scatter(X_kpca[y==1, 0], X_kpca[y==1, 1],
            color='blue', marker='o', alpha=0.5)

ax[1].scatter(X_kpca[y==0, 0], np.zeros((500,1))+0.02,
            color='red', marker='^', alpha=0.5)
ax[1].scatter(X_kpca[y==1, 0], np.zeros((500,1))-0.02,
            color='blue', marker='o', alpha=0.5)

ax[0].set_xlabel('PC1')
ax[0].set_ylabel('PC2')
ax[1].set_ylim([-1, 1])
ax[1].set_yticks([])
ax[1].set_xlabel('PC1')

plt.tight_layout()
# plt.savefig('./figures/circles_3.png', dpi=300)
plt.show()

使其两个类别线性可分。
映射新的数据点:
以上案例基于单一数据集映射到一个新的特征上,实际上需要转换多个数据集。
# 修改过后的rbf_kernel_pca方法
from scipy.spatial.distance import pdist, squareform
from scipy import exp
from scipy.linalg import eigh
import numpy as np

def rbf_kernel_pca(X, gamma, n_components):
    """
    RBF kernel PCA implementation.

    Parameters
    ------------
    X: {NumPy ndarray}, shape = [n_samples, n_features]

    gamma: float
      Tuning parameter of the RBF kernel

    n_components: int
      Number of principal components to return

    Returns
    ------------
     X_pc: {NumPy ndarray}, shape = [n_samples, k_features]
       Projected dataset

     lambdas: list
       Eigenvalues

    """
    # Calculate pairwise squared Euclidean distances
    # in the MxN dimensional dataset.
    sq_dists = pdist(X, 'sqeuclidean')

    # Convert pairwise distances into a square matrix.
    mat_sq_dists = squareform(sq_dists)

    # Compute the symmetric kernel matrix.
    K = exp(-gamma * mat_sq_dists)

    # Center the kernel matrix.
    N = K.shape[0]
    one_n = np.ones((N,N)) / N
    K = K - one_n.dot(K) - K.dot(one_n) + one_n.dot(K).dot(one_n)

    # Obtaining eigenpairs from the centered kernel matrix
    # numpy.eigh returns them in sorted order
    eigvals, eigvecs = eigh(K)

    # Collect the top k eigenvectors (projected samples)
    alphas = np.column_stack((eigvecs[:,-i] for i in range(1,n_components+1)))

    # 修改处,收集相应的特征值
    lambdas = [eigvals[-i] for i in range(1,n_components+1)]

    return alphas, lambdas
# 创建新的半月形数据集,使用更新过的RBF核PCA实现映射到一个一维子空间上。
X, y = make_moons(n_samples=100, random_state=123)
alphas, lambdas = rbf_kernel_pca(X, gamma=15, n_components=1)
# 假设半月形的数据集中的第26个点是新的数据点x‘。将其映射到子空间中。
x_new = X[25]
x_new

x_proj = alphas[25] # 原始投影
x_proj
# 重现原始映射,使用project_x函数,可以映射新的数据样本。
def project_x(x_new, X, gamma, alphas, lambdas):
    pair_dist = np.array([np.sum((x_new-row)**2) for row in X])
    k = np.exp(-gamma * pair_dist)
    return k.dot(alphas / lambdas)
# “新”数据点的投影。
x_reproj = project_x(x_new, X, gamma=15, alphas=alphas, lambdas=lambdas)
x_reproj
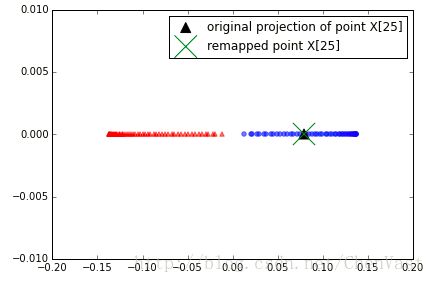
# 将第一主成分是的映射进行可视化
plt.scatter(alphas[y==0, 0], np.zeros((50)),
            color='red', marker='^',alpha=0.5)
plt.scatter(alphas[y==1, 0], np.zeros((50)),
            color='blue', marker='o', alpha=0.5)
plt.scatter(x_proj, 0, color='black', label='original projection of point X[25]', marker='^', s=100)
plt.scatter(x_reproj, 0, color='green', label='remapped point X[25]', marker='x', s=500)
plt.legend(scatterpoints=1)

plt.tight_layout()
# plt.savefig('./figures/reproject.png', dpi=300)
plt.show()

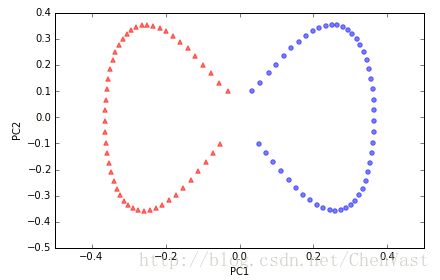
Scikit-learn中的核主成分分析:
# kernel参数可选择不同的核函数
from sklearn.decomposition import KernelPCA

X, y = make_moons(n_samples=100, random_state=123)
scikit_kpca = KernelPCA(n_components=2, kernel='rbf', gamma=15)
X_skernpca = scikit_kpca.fit_transform(X)

plt.scatter(X_skernpca[y==0, 0], X_skernpca[y==0, 1],
            color='red', marker='^', alpha=0.5)
plt.scatter(X_skernpca[y==1, 0], X_skernpca[y==1, 1],
            color='blue', marker='o', alpha=0.5)

plt.xlabel('PC1')
plt.ylabel('PC2')
plt.tight_layout()
# plt.savefig('./figures/scikit_kpca.png', dpi=300)
plt.show()
