import pandas as pd
import urllib.request
import shutil
import zipfile
import os
try:
os.system('mkdir bike_data')
except:
os.system('rm -rf bike_data; mkdir bike_data')
data_source = 'http://archive.ics.uci.edu/ml/machine-learning-databases/00275/Bike-Sharing-Dataset.zip'
zipname = 'bike_data/Bike-Sharing-Dataset.zip'
urllib.request.urlretrieve(data_source, zipname)
zip_ref = zipfile.ZipFile(zipname, 'r')
zip_ref.extractall('bike_data')
zip_ref.close()
daily_path = 'bike_data/day.csv'
daily_data = pd.read_csv(daily_path)
daily_data['dteday'] = pd.to_datetime(daily_data['dteday'])
drop_list = ['instant', 'season', 'yr', 'mnth', 'holiday', 'workingday', 'weathersit', 'atemp', 'hum']
daily_data.drop(drop_list, inplace = True, axis = 1)
daily_data.head()
.dataframe tbody tr th:only-of-type { vertical-align: middle; } .dataframe tbody tr th { vertical-align: top; } .dataframe thead th { text-align: right; }
|
dteday |
weekday |
temp |
windspeed |
casual |
registered |
cnt |
| 0 |
2011-01-01 |
6 |
0.344167 |
0.160446 |
331 |
654 |
985 |
| 1 |
2011-01-02 |
0 |
0.363478 |
0.248539 |
131 |
670 |
801 |
| 2 |
2011-01-03 |
1 |
0.196364 |
0.248309 |
120 |
1229 |
1349 |
| 3 |
2011-01-04 |
2 |
0.200000 |
0.160296 |
108 |
1454 |
1562 |
| 4 |
2011-01-05 |
3 |
0.226957 |
0.186900 |
82 |
1518 |
1600 |
from __future__ import division, print_function
from matplotlib import pyplot as plt
import pandas as pd
import numpy as np
%matplotlib inline
import matplotlib
matplotlib.rc('figure', figsize = (14, 7))
matplotlib.rc('font', size = 14)
matplotlib.rc('axes.spines', top = False, right = False)
matplotlib.rc('axes', grid = False)
matplotlib.rc('axes', facecolor = 'white')
def scatterplot(x_data, y_data, x_label, y_label, title):
fig, ax = plt.subplots()
ax.scatter(x_data, y_data, s = 10, color = '#539caf', alpha = 0.75)
ax.set_title(title)
ax.set_xlabel(x_label)
ax.set_ylabel(y_label)
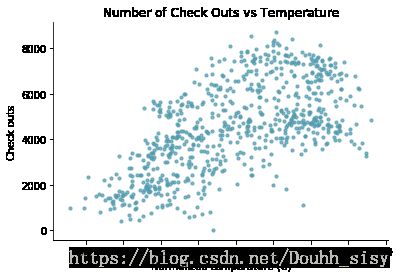
scatterplot(x_data = daily_data['temp'].values
, y_data = daily_data['cnt'].values
, x_label = 'Normalized temperature (C)'
, y_label = 'Check outs'
, title = 'Number of Check Outs vs Temperature')
import statsmodels.api as sm
from statsmodels.stats.outliers_influence import summary_table
x = sm.add_constant(daily_data['temp'])
y = daily_data['cnt']
regr = sm.OLS(y, x)
res = regr.fit()
st, data, ss2 = summary_table(res, alpha=0.05)
fitted_values = data[:,2]
def lineplot(x_data, y_data, x_label, y_label, title):
_, ax = plt.subplots()
ax.plot(x_data, y_data, lw = 2, color = '#539caf', alpha = 1)
ax.set_title(title)
ax.set_xlabel(x_label)
ax.set_ylabel(y_label)
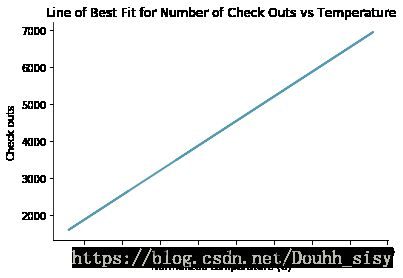
lineplot(x_data = daily_data['temp']
, y_data = fitted_values
, x_label = 'Normalized temperature (C)'
, y_label = 'Check outs'
, title = 'Line of Best Fit for Number of Check Outs vs Temperature')
C:\ProgramData\Anaconda3\lib\site-packages\statsmodels\compat\pandas.py:56: FutureWarning: The pandas.core.datetools module is deprecated and will be removed in a future version. Please use the pandas.tseries module instead.
  from pandas.core import datetools
predict_mean_ci_low, predict_mean_ci_upp = data[:,4:6].T
CI_df = pd.DataFrame(columns = ['x_data', 'low_CI', 'upper_CI'])
CI_df['x_data'] = daily_data['temp']
CI_df['low_CI'] = predict_mean_ci_low
CI_df['upper_CI'] = predict_mean_ci_upp
CI_df.sort_values('x_data', inplace = True)
def lineplotCI(x_data, y_data, sorted_x, low_CI, upper_CI, x_label, y_label, title):
_, ax = plt.subplots()
ax.plot(x_data, y_data, lw = 1, color = '#539caf', alpha = 1, label = 'Fit')
ax.fill_between(sorted_x, low_CI, upper_CI, color = '#539caf', alpha = 0.4, label = '95% CI')
ax.set_title(title)
ax.set_xlabel(x_label)
ax.set_ylabel(y_label)
ax.legend(loc = 'best')
lineplotCI(x_data = daily_data['temp']
, y_data = fitted_values
, sorted_x = CI_df['x_data']
, low_CI = CI_df['low_CI']
, upper_CI = CI_df['upper_CI']
, x_label = 'Normalized temperature (C)'
, y_label = 'Check outs'
, title = 'Line of Best Fit for Number of Check Outs vs Temperature')

def lineplot2y(x_data, x_label, y1_data, y1_color, y1_label, y2_data, y2_color, y2_label, title):
_, ax1 = plt.subplots()
ax1.plot(x_data, y1_data, color = y1_color)
ax1.set_ylabel(y1_label, color = y1_color)
ax1.set_xlabel(x_label)
ax1.set_title(title)
ax2 = ax1.twinx()
ax2.plot(x_data, y2_data, color = y2_color)
ax2.set_ylabel(y2_label, color = y2_color)
ax2.spines['right'].set_visible(True)
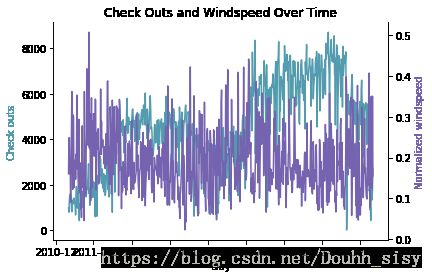
lineplot2y(x_data = daily_data['dteday']
, x_label = 'Day'
, y1_data = daily_data['cnt']
, y1_color = '#539caf'
, y1_label = 'Check outs'
, y2_data = daily_data['windspeed']
, y2_color = '#7663b0'
, y2_label = 'Normalized windspeed'
, title = 'Check Outs and Windspeed Over Time')
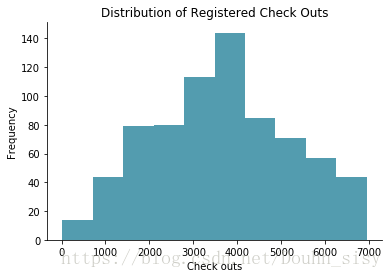
def histogram(data, x_label, y_label, title):
_, ax = plt.subplots()
res = ax.hist(data, color = '#539caf', bins=10)
ax.set_ylabel(y_label)
ax.set_xlabel(x_label)
ax.set_title(title)
return res
res = histogram(data = daily_data['registered']
, x_label = 'Check outs'
, y_label = 'Frequency'
, title = 'Distribution of Registered Check Outs')
res[0]
res[1]
array([  20. ,  712.6, 1405.2, 2097.8, 2790.4, 3483. , 4175.6, 4868.2,
       5560.8, 6253.4, 6946. ])
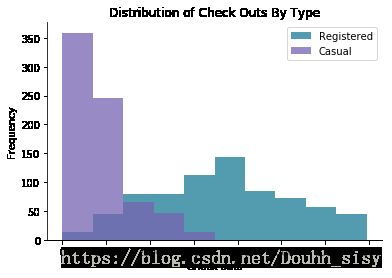
def overlaid_histogram(data1, data1_name, data1_color, data2, data2_name, data2_color, x_label, y_label, title):
max_nbins = 10
data_range = [min(min(data1), min(data2)), max(max(data1), max(data2))]
binwidth = (data_range[1] - data_range[0]) / max_nbins
bins = np.arange(data_range[0], data_range[1] + binwidth, binwidth)
_, ax = plt.subplots()
ax.hist(data1, bins = bins, color = data1_color, alpha = 1, label = data1_name)
ax.hist(data2, bins = bins, color = data2_color, alpha = 0.75, label = data2_name)
ax.set_ylabel(y_label)
ax.set_xlabel(x_label)
ax.set_title(title)
ax.legend(loc = 'best')
overlaid_histogram(data1 = daily_data['registered']
, data1_name = 'Registered'
, data1_color = '#539caf'
, data2 = daily_data['casual']
, data2_name = 'Casual'
, data2_color = '#7663b0'
, x_label = 'Check outs'
, y_label = 'Frequency'
, title = 'Distribution of Check Outs By Type')
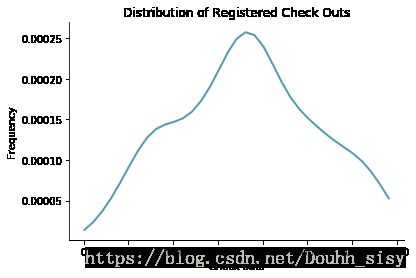
from scipy.stats import gaussian_kde
data = daily_data['registered']
density_est = gaussian_kde(data)
density_est.covariance_factor = lambda : .3
density_est._compute_covariance()
x_data = np.arange(min(data), max(data), 200)
def densityplot(x_data, density_est, x_label, y_label, title):
_, ax = plt.subplots()
ax.plot(x_data, density_est(x_data), color = '#539caf', lw = 2)
ax.set_ylabel(y_label)
ax.set_xlabel(x_label)
ax.set_title(title)
densityplot(x_data = x_data
, density_est = density_est
, x_label = 'Check outs'
, y_label = 'Frequency'
, title = 'Distribution of Registered Check Outs')
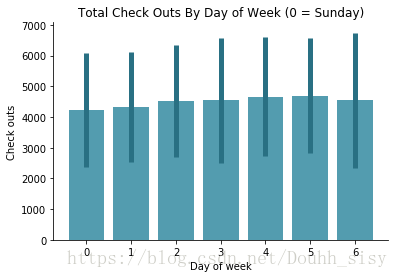
mean_total_co_day = daily_data[['weekday', 'cnt']].groupby('weekday').agg([np.mean, np.std])
mean_total_co_day.columns = mean_total_co_day.columns.droplevel()
def barplot(x_data, y_data, error_data, x_label, y_label, title):
_, ax = plt.subplots()
ax.bar(x_data, y_data, color = '#539caf', align = 'center')
ax.errorbar(x_data, y_data, yerr = error_data, color = '#297083', ls = 'none', lw = 5)
ax.set_ylabel(y_label)
ax.set_xlabel(x_label)
ax.set_title(title)
barplot(x_data = mean_total_co_day.index.values
, y_data = mean_total_co_day['mean']
, error_data = mean_total_co_day['std']
, x_label = 'Day of week'
, y_label = 'Check outs'
, title = 'Total Check Outs By Day of Week (0 = Sunday)')
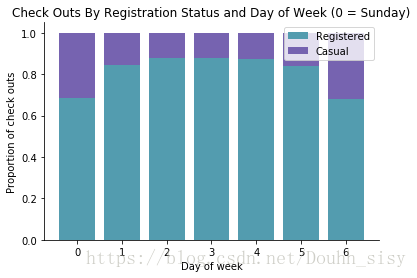
mean_by_reg_co_day = daily_data[['weekday', 'registered', 'casual']].groupby('weekday').mean()
mean_by_reg_co_day['total'] = mean_by_reg_co_day['registered'] + mean_by_reg_co_day['casual']
mean_by_reg_co_day['reg_prop'] = mean_by_reg_co_day['registered'] / mean_by_reg_co_day['total']
mean_by_reg_co_day['casual_prop'] = mean_by_reg_co_day['casual'] / mean_by_reg_co_day['total']
def stackedbarplot(x_data, y_data_list, y_data_names, colors, x_label, y_label, title):
_, ax = plt.subplots()
for i in range(0, len(y_data_list)):
if i == 0:
ax.bar(x_data, y_data_list[i], color = colors[i], align = 'center', label = y_data_names[i])
else:
ax.bar(x_data, y_data_list[i], color = colors[i], bottom = y_data_list[i - 1], align = 'center', label = y_data_names[i])
ax.set_ylabel(y_label)
ax.set_xlabel(x_label)
ax.set_title(title)
ax.legend(loc = 'upper right')
stackedbarplot(x_data = mean_by_reg_co_day.index.values
, y_data_list = [mean_by_reg_co_day['reg_prop'], mean_by_reg_co_day['casual_prop']]
, y_data_names = ['Registered', 'Casual']
, colors = ['#539caf', '#7663b0']
, x_label = 'Day of week'
, y_label = 'Proportion of check outs'
, title = 'Check Outs By Registration Status and Day of Week (0 = Sunday)')
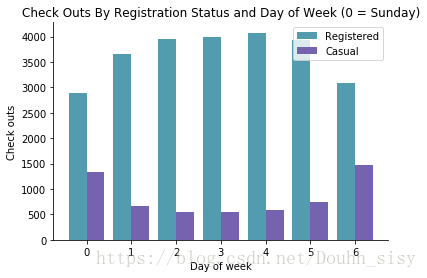
def groupedbarplot(x_data, y_data_list, y_data_names, colors, x_label, y_label, title):
_, ax = plt.subplots()
total_width = 0.8
ind_width = total_width / len(y_data_list)
alteration = np.arange(-total_width/2+ind_width/2, total_width/2+ind_width/2, ind_width)
for i in range(0, len(y_data_list)):
ax.bar(x_data + alteration[i], y_data_list[i], color = colors[i], label = y_data_names[i], width = ind_width)
ax.set_ylabel(y_label)
ax.set_xlabel(x_label)
ax.set_title(title)
ax.legend(loc = 'upper right')
groupedbarplot(x_data = mean_by_reg_co_day.index.values
, y_data_list = [mean_by_reg_co_day['registered'], mean_by_reg_co_day['casual']]
, y_data_names = ['Registered', 'Casual']
, colors = ['#539caf', '#7663b0']
, x_label = 'Day of week'
, y_label = 'Check outs'
, title = 'Check Outs By Registration Status and Day of Week (0 = Sunday)')
days = np.unique(daily_data['weekday'])
bp_data = []
for day in days:
bp_data.append(daily_data[daily_data['weekday'] == day]['cnt'].values)
def boxplot(x_data, y_data, base_color, median_color, x_label, y_label, title):
_, ax = plt.subplots()
ax.boxplot(y_data
, patch_artist = True
, medianprops = {'color': base_color}
, boxprops = {'color': base_color, 'facecolor': median_color}
, whiskerprops = {'color': median_color}
, capprops = {'color': base_color})
ax.set_xticklabels(x_data)
ax.set_ylabel(y_label)
ax.set_xlabel(x_label)
ax.set_title(title)
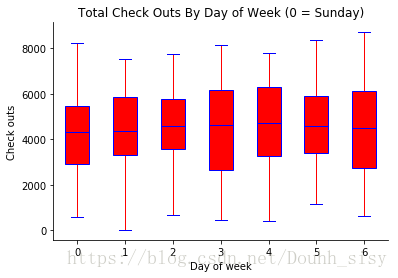
boxplot(x_data = days
, y_data = bp_data
, base_color = 'b'
, median_color = 'r'
, x_label = 'Day of week'
, y_label = 'Check outs'
, title = 'Total Check Outs By Day of Week (0 = Sunday)')
