matplotlib数据可视化分析(6)-- matplotlib 条形图的绘制
什么是条形图
以长方形的长度为变量的统计图表
用来比较多个项目分类的数据大小
通常用于比较较小的数据集分析
例如不同季度的销量,不同国家的人口等
基本用法
# coding:utf-8
import matplotlib.pyplot as plt
import numpy as np

N = 5

y = [20, 10, 30, 25, 15]

index = np.arange(N)
print index

# plt.bar(left=index, height=y, color='blue', width=0.8)

# plt.bar(left=0, bottom=index, width=y, color='red', height=0.5,
#         orientation='horizontal')
plt.barh(left=0, bottom=index, width=y)

plt.show()
需要说明的是 orientation 表示的是水平的条形图,也可以用 barh 来绘制。
多个条形图的对比
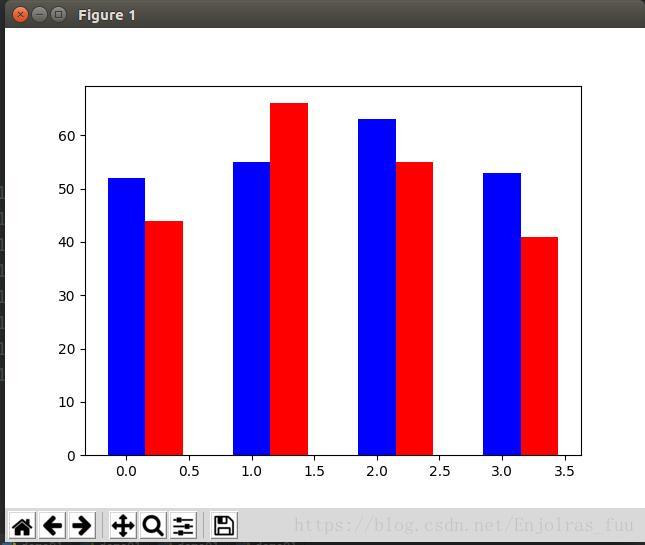
北京和上海的商品销量的对比图
# coding:utf-8
import matplotlib.pyplot as plt
import numpy as np

index = np.arange(4)

sales_BJ = [52, 55, 63, 53]
sales_SH = [44, 66, 55, 41]

bar_width = 0.3

plt.bar(index, sales_BJ, bar_width, color='b')
plt.bar(index+bar_width, sales_SH, bar_width, color='r')
plt.show()
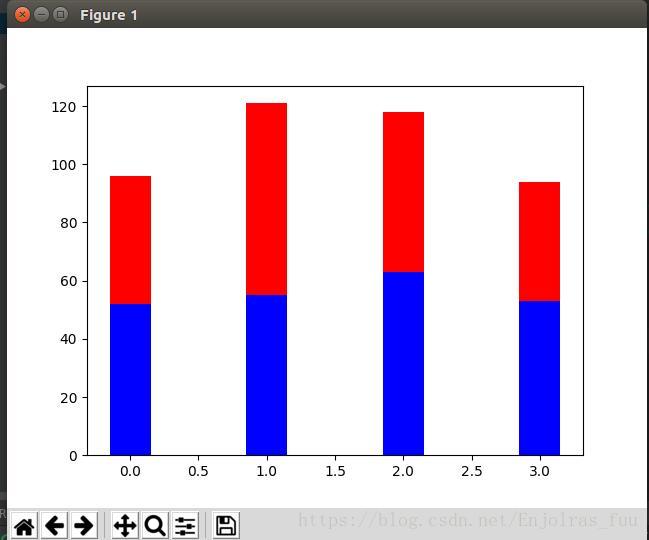
生成层叠图的效果
# coding:utf-8
import matplotlib.pyplot as plt
import numpy as np

index = np.arange(4)

sales_BJ = [52, 55, 63, 53]
sales_SH = [44, 66, 55, 41]

bar_width = 0.3

plt.bar(index, sales_BJ, bar_width, color='b')
plt.bar(index, sales_SH, bar_width, color='r', bottom=sales_BJ)
plt.show()

