用tensorflow实现线性回归
""""
use tensorflow to realize linear regression

Tensorflow是一个通过计算图的形式来表述计算的编程系统
"""

# 导入包
import numpy as np
import tensorflow as tf
import matplotlib.pyplot as plt

# 使用numpy生成200个随机点(曲线:y=x*2)
x_data = np.linspace(-0.5, 0.5, 200)[:, np.newaxis]  # 生成[-0.5,0.5]之间均匀分布的200个点,并将其转为(200,1)的列向量
noise = np.random.normal(0, 0.2, x_data.shape)   # 根据x_data的维度,生成噪声向量
y_data = np.square(x_data) + noise   # 在函数中加入噪声得到曲线周围的样本点

# ################  使用tensorflow建立计算图  #########################
# 定义两个placeholder存放输入数据
x = tf.placeholder(tf.float32, [None, 1], name='x')
y = tf.placeholder(tf.float32, [None, 1], name='x')

# 定义神经网络中间层
Weights_L1 = tf.Variable(tf.random.normal([1, 10]))  # 权重初始化为(1,10)行向量(因为每次样本输入只有一个x,即特征x只有1个?)
biases_L1 = tf.Variable(tf.zeros([1, 10]))  # 偏置设为(1,10)全零行向量
Wx_plus_b_L1 = tf.add(tf.matmul(x, Weights_L1), biases_L1)  # z=Wx+b
L1 = tf.nn.tanh(Wx_plus_b_L1)     # 加入激活函数

# 定义神经网络输出层
Weight_L2 = tf.Variable(tf.random.normal([10, 1]))
biases_L2 = tf.Variable(tf.zeros([1, 1]))
Wx_plus_b_L2 = tf.add(tf.matmul(L1, Weight_L2), biases_L2)  # z=Wx+b
prediction = tf.nn.tanh(Wx_plus_b_L2)     # 加入激活函数

# 定义损失函数(均方差函数)
loss = tf.reduce_mean(tf.square(y - prediction))  # reduce_mean计算的是所有元素累加再求均值

# 定义反向传播算法(使用梯度下降算法训练)
train_step = tf.train.GradientDescentOptimizer(0.1).minimize(loss)  # 学习率0.1

# 初始化所有变量
init = tf.global_variables_initializer()

# ################  使用tensorflow执行计算  #########################
with tf.Session() as sess:
    sess.run(init)
    for i in range(2000):
        sess.run(train_step, feed_dict={x: x_data, y: y_data})
        # if i % 100 == 0:
        #     print(sess.run(loss, feed_dict={x: x_data, y: y_data}))  # 每100步打印cost

    # 获取预测值
    prediction_value = sess.run(prediction, feed_dict={x: x_data})   # (200,1)

    # 画图
    plt.figure()
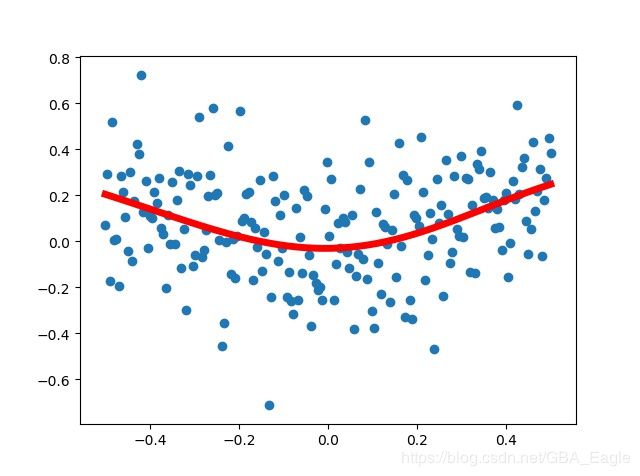
    plt.scatter(x_data, y_data)  # 真实值,散点

    plt.plot(x_data, prediction_value, 'r-', lw=5)  # 预测曲线
    plt.show()
运行结果:
