pyCharm pyplot.show()不显示图表的解决
现象:
import pandas as pd
from numpy import *
import matplotlib.pyplot as plt
import matplotlib as mpl


ts = pd.Series(random.randn(1000), index=pd.date_range('1/1/2000', periods=1000))
ts = ts.cumsum()
ts.plot()
plt.show()
执行完毕(Process finished with exit code 0),但不显示图表。
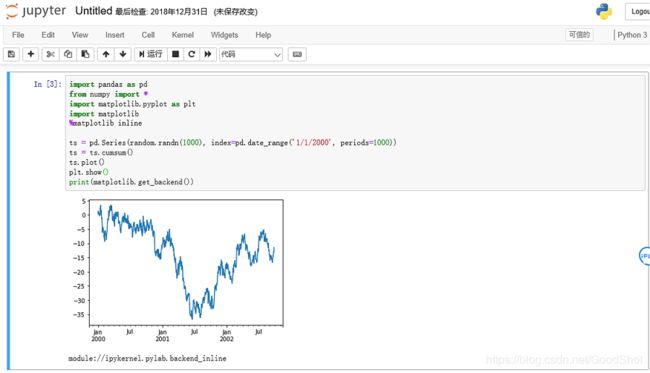
但在jupter notebook中,可以正常显示图表
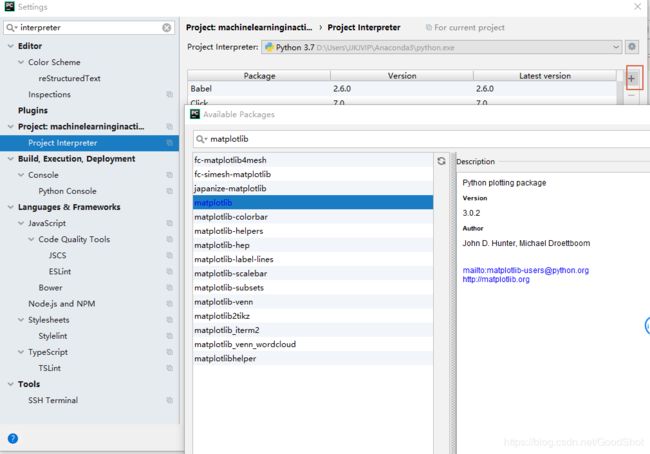
在setting的interpretor中看到解释器为3.7
 (很奇怪,conda list显示没有该模块,但jupter能显示,pycharm中却没有matplotlib)
在源代码plot.show()后添加
print(mpl.get_backend())
执行,显示 “module://backend_interagg”
根据网上资料,修改上面的backend,即
import pandas as pd
from numpy import *
import matplotlib.pyplot as plt
import matplotlib as mpl
mpl.use('TkAgg')

ts = pd.Series(random.randn(1000), index=pd.date_range('1/1/2000', periods=1000))
ts = ts.cumsum()
ts.plot()
plt.show()
print(mpl.get_backend())
import matplotlib as mpl
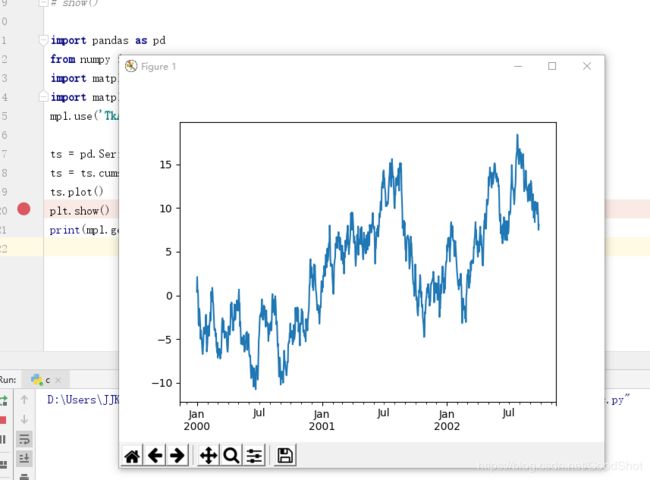
mpl.use('TkAgg') (核心修改处)
则显示正常,如下:


