sklearn中集成学(Ensemble methods)习部分(上)
1.11 集成方法(Ensemble methods)
▲集成方法的目的是集合多种基本的预测模型,以提高单一模型的泛化能力和鲁棒性。
▲两种类型的集成方法:
•平均估计:主要原理平均几个独立预测模型的预测结果。通常,该模型主要是以减小方差为目的,因此结合的预测结果比任何一个单一的预测结果都好。比如:Bagging,随机森林等。
•boosting方法:该集成方法主要目的是减少偏差。集合弱学习器生产强学习器。比如:AdaBoost,Gradient TreeBoosting等。
1.11.1 Bagging估计(Bagging meta-estimator)
▲该估计算法,主要是在原始数据集中,采用自助采样法生产多个数据集,通过这些数据集训练学习器,在集合这些学习器的结果,得到最终的结果。这些方法主要以减少方差为主要目的。在多数情况下,Bagging方法通过简单的方法去提升一个单一的模型,因此使得结果并不是与基本的方法结果一致。在减小过拟合方面,bagging方法在集成强大复杂的模型方面表现较好,而boosting方法在集成弱学习器方面表现较好。
▲bagging集成方法因划分训练子集的方式不同可分为不同的模型:
•Pasting:训练样本为整个数据集的随机子集
•Bagging:训练样本通过整个数据集的抽取-放回-抽取所得
•Random Subspace:训练样本通过整个数据集的属性随机而得
•Random Patches:训练样本通过整个数据集的数据和属性随机而得
▲在scikit-learn中,bagging方法由BaggingClassifier统一提供,以用户输入的基模型和划分子集的方法作为参数。其中,max_samples和max_features控制子集的大小,而bootstrap和bootstrap_features控制数据样本和属性是否替换。Oob_score=True可使得估计时采用已有的数据划分样本。如下例子,展示了使用bagging方法集成KNeighborClassifier估计,其训练样本划分规则为:随机50%的数据样本和50%的属性。
>>> from sklearn.ensemble import BaggingClassifier
>>> from sklearn.neighbors import KNeighborsClassifier
>>> bagging = BaggingClassifier(KNeighborsClassifier(),
...                             max_samples=0.5, max_features=0.5)
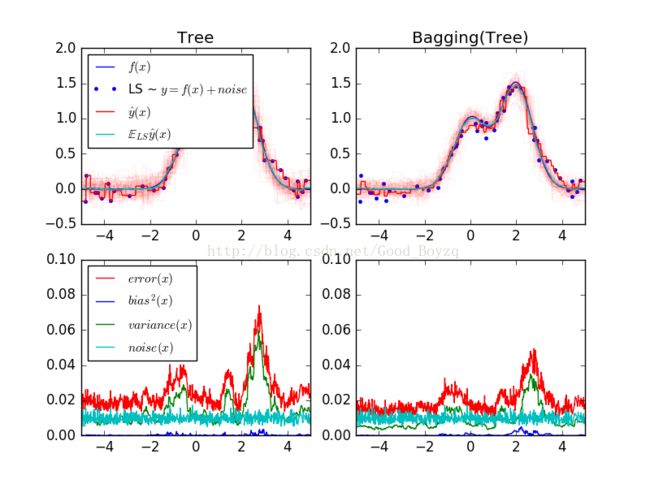
下图展示了单一模型(决策回归树)Bagging集成算法在偏差-方差上的比较,更具体的分析可看:http://scikit-learn.org/stable/auto_examples/ensemble/plot_bias_variance.html#sphx-glr-auto-examples-ensemble-plot-bias-variance-py
相关代码为:
# -*- coding: utf-8 -*-
"""
Created on Sat Jan 21 14:37:54 2017

@author: ZQ
"""

import numpy as np
import matplotlib.pyplot as plt

from sklearn.ensemble import BaggingRegressor
from sklearn.tree import DecisionTreeRegressor

#数据集
n_repeat = 50 #计算期望的迭代数
n_train = 50 #训练数据集大小
n_test = 1000 #测试数据集大小
nosie = 0.1
np.random.seed(0)

estimators = [("Tree",DecisionTreeRegressor()),
              ("Bagging(Tree)",BaggingRegressor(DecisionTreeRegressor()))]
n_estimators = len(estimators)

#生产数据
def f(x):
    x = x.ravel()
    return np.exp(-x**2) + 1.5*np.exp(-(x-2)**2)

def generate(n_sample,noise,n_repeat = 1):
    X = np.random.rand(n_sample)*10 - 5
    X = np.sort(X)
    if n_repeat == 1:
        y = f(X) + np.random.normal(0.0,noise,n_sample)#正态分布
    else:
        y = np.zeros((n_sample,n_repeat))
        for i in range(n_repeat):
            y[:,i] = f(X) + np.random.normal(0.0,nosie,n_sample)
    X = X.reshape((n_sample,1))
    return X,y

X_train = []
y_train = []

for i in range(n_repeat):
    X,y = generate(n_sample=n_train,noise=nosie)
    X_train.append(X)
    y_train.append(y)

X_test,y_test = generate(n_sample=n_test,noise=nosie,n_repeat=n_repeat)

#循环对学习方法进行比较
for n,(name,estimator) in enumerate(estimators):
    y_predict = np.zeros((n_test,n_repeat))
    for i in range(n_repeat):
        estimator.fit(X_train[i],y_train[i])
        y_predict[:,i] = estimator.predict(X_test)
    y_error = np.zeros(n_test)
    for i in range(n_repeat):
        for j in range(n_repeat):
            y_error += (y_test[:,j]-y_predict[:,i])**2
    y_error /= (n_repeat*n_repeat)
    y_noise = np.var(y_test,axis = 1)
    y_bias = (f(X_test) - np.mean(y_predict,axis = 1)) ** 2
    y_var = np.var(y_predict,axis = 1)

    plt.subplot(2, n_estimators, n + 1)
    plt.plot(X_test, f(X_test), "b", label="$f(x)$")
    plt.plot(X_train[0], y_train[0], ".b", label="LS ~ $y = f(x)+noise$")

    for i in range(n_repeat):
        if i == 0:
            plt.plot(X_test, y_predict[:, i], "r", label="$\^y(x)$")
        else:
            plt.plot(X_test, y_predict[:, i], "r", alpha=0.05)

    plt.plot(X_test, np.mean(y_predict, axis=1), "c",
             label="$\mathbb{E}_{LS} \^y(x)$")

    plt.xlim([-5, 5])
    plt.title(name)

    if n == 0:
        plt.legend(loc="upper left", prop={"size": 11})

    plt.subplot(2, n_estimators, n_estimators + n + 1)
    plt.plot(X_test, y_error, "r", label="$error(x)$")
    plt.plot(X_test, y_bias, "b", label="$bias^2(x)$"),
    plt.plot(X_test, y_var, "g", label="$variance(x)$"),
    plt.plot(X_test, y_noise, "c", label="$noise(x)$")

    plt.xlim([-5, 5])
    plt.ylim([0, 0.1])

    if n == 0:
        plt.legend(loc="upper left", prop={"size": 11})

plt.show()
1.11.2 随机树森林(Forests of randomized trees)
▲在sklearn.ensemble模块中包含了两种基于决策树的平均集成算法:随机森林(the RandomForest)和极端随机树(Extra-Trees)。这两种算法专门为树模型设计,这意味着在构造基学习模型时,引入随机性。这个预测结果通过各个基模型的结果的平均。
▲与其他分类器相同,该分类器的拟合必须提供两个数组:大小为[n_samples,n_features]的X数组,包含训练样本;大小为[n_samples]的Y数组,包含训练样本的标签。可扩展为多分类问题。
>>> from sklearn.ensemble import RandomForestClassifier
>>> X = [[0, 0], [1, 1]]
>>> Y = [0, 1]
>>> clf = RandomForestClassifier(n_estimators=10)#n_estimators为决策树的个数
>>> clf = clf.fit(X, Y)
1.11.2.1 随机森林(randomforests)
▲在随机森林中,每个决策树都是通过反复抽取数据集中的数据生成的训练集所拟合。此外,在生产决策树的过程中,节点的选择不再是属性中的最佳属性;节点为子集的最佳拆分节点。由于该随机性,森林的偏差通常略有增加;由于平均的原因,其方差会减少;会补偿偏差,因此该模型的整体收益较好。与原始版本相反,sklearn通过平均概率的方式集成,而不是通过投票的方式。
1.11.2.2 极端随机树(ExtremelyRandomized Trees)
▲在极端随机树中,在拆分节点的过程中随机性会更进一步的进行考虑。在极端随机树中,训练集为属性的随机组合,在节点分割时,并不是寻找最佳分割阈值,而是随机的抽取。通常该模型会更进一步的减少方差,但是其偏差会相对于增加。
>>> from sklearn.model_selection import cross_val_score
>>> from sklearn.datasets import make_blobs
>>> from sklearn.ensemble import RandomForestClassifier
>>> from sklearn.ensemble import ExtraTreesClassifier
>>> from sklearn.tree import DecisionTreeClassifier

>>> X, y = make_blobs(n_samples=10000, n_features=10, centers=100,
...     random_state=0)

>>> clf = DecisionTreeClassifier(max_depth=None, min_samples_split=2,
...     random_state=0)
>>> scores = cross_val_score(clf, X, y)
>>> scores.mean()
0.97...

>>> clf = RandomForestClassifier(n_estimators=10, max_depth=None,
...     min_samples_split=2, random_state=0)
>>> scores = cross_val_score(clf, X, y)
>>> scores.mean()
0.999...

>>> clf = ExtraTreesClassifier(n_estimators=10, max_depth=None,
...     min_samples_split=2, random_state=0)
>>> scores = cross_val_score(clf, X, y)
>>> scores.mean() > 0.999
True
1.11.2.3 参数(Parameters)
▲主要设置的参数包括n_estimators和max_features。前者是森林中树的多少,越大越好,但是其计算的时间就会变长;但是在超过一定值后,结果将不会再用变化。后者是在划分节点时,随机子集中属性数目的多少;越低方差越小,其偏差会增高。在回归问题中,max_features=n_features最好;在分类问题中,max_features=sqrt(n_fetures)(n_features是数据集中的属性数目)。令max_depth=None,及min_samples_split=1时,取得的结果较好(即充分发展树)。这些参数通常不是最优的,可能会消耗大量的内存。最好的参数通常通过交叉验证获得。Bootstrap参数在随机森林和极端随机森林中默认值不相同,前者为True,后者为False。
1.11.2.4 并行化(Parallelization)
▲本模块可通过n_jobs参数设置并行计算和并行结构。如n_jobs=k,则需要在k核计算机上运行;如n_jobs=-1,则所有的计算机均可运行。这里k个作业可能不是k倍速度;但是在构建大量决策树和使用大量数据时,有明显的提速效果。
1.11.2.5 特征重要性估计(Feature importanceevaluation)
▲在决策树中,属性节点的深度可以用来评价该属性的相对重要程度。在大比例样本输入时,决策树顶的属性有助于做出预测结果。样本得到的结果可以用来反映这些特征的重要性。下面的例子是一个颜色编码,其中展示了利用ExtraTreesClassifier模型的人脸识别中,每个像素的重要性。

相关代码:
# -*- coding: utf-8 -*-
"""
Created on Tue Jan 24 22:52:31 2017

@author: ZQ
"""

from time import time
import matplotlib.pyplot as plt

from sklearn.datasets import fetch_olivetti_faces
from sklearn.ensemble import ExtraTreesClassifier

#多线程工作
n_jobs = 1

#加载数据
data = fetch_olivetti_faces()
X = data.images.reshape((len(data.images),-1))
y = data.target

mask = y<5
X = X[mask]
y = y[mask]

#计算像素的重要程度
print("Fitting ExtraTreesClassifier on faces data with %d cores..." % n_jobs)
t0 = time()
forest = ExtraTreesClassifier(n_estimators=1000,
                              max_features=128,
                              n_jobs=n_jobs,
                              random_state=0)
forest.fit(X,y)
print("done in %0.3fs"%(time()-t0))

importances = forest.feature_importances_
importances = importances.reshape(data.images[0].shape)

plt.matshow(importances,cmap = plt.cm.hot)
plt.title('Pixel importances with forests of trees')
plt.show()
1.11.2.6 嵌入式完全随机树(TotallyRandom Trees Embedding)
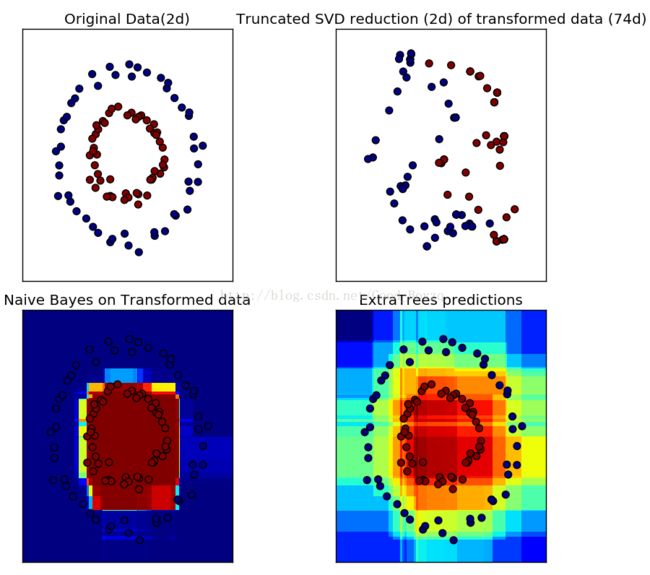
▲RandomTreesEmbedding实现了数据的无监督学习。其编码方式以1到k的方式,从高维数据到稀疏二进制编码。这种编码方式很有效,可以用作其他学习任务的基础。通过选择树的个数和深度可以决定该编码的大小和稀疏程度。在集成中的每个树,其编码包括了每个完整的树。编码的最大大小为n_estimators*2**max_depth,森林中树叶的最大值。邻近的数据点很可能具有相同的树叶节点,其间的转换时隐式、非参数的密度估计。下面的例子是使用完全随机树进行hash转换:http://scikit-learn.org/stable/auto_examples/ensemble/plot_random_forest_embedding.html#sphx-glr-auto-examples-ensemble-plot-random-forest-embedding-py

相关代码:
# -*- coding: utf-8 -*-
"""
Created on Wed Jan 25 15:34:53 2017

@author: ZQ
"""

import numpy as np
import matplotlib.pyplot as plt

from sklearn.datasets import make_circles
from sklearn.ensemble import RandomTreesEmbedding,ExtraTreesClassifier
from sklearn.decomposition import TruncatedSVD
from sklearn.naive_bayes import BernoulliNB

#创建一个数据集
X,y = make_circles(factor=0.5,random_state=0,noise=0.05)

#使用RandomTreesEmbedding转换数据
hasher = RandomTreesEmbedding(n_estimators=10,
                              random_state=0,
                              max_depth=3)
X_transformed = hasher.fit_transform(X)
#使用截断奇异值分解降低数据维数
svd = TruncatedSVD(n_components=2)
X_reduced = svd.fit_transform(X_transformed)

#拟合贝叶斯分类器
nb = BernoulliNB()
nb.fit(X_transformed,y)
#利用极端随机树进行学习
trees = ExtraTreesClassifier(max_depth=3,
                             n_estimators=10,
                             random_state=0)
trees.fit(X,y)

#原始和减少后的散点图
fig = plt.figure(figsize=(9,8))

ax = plt.subplot(221)
ax.scatter(X[:,0],X[:,1],c=y,s=50)
ax.set_title("Original Data(2d)")
ax.set_xticks(())
ax.set_yticks(())

ax = plt.subplot(222)
ax.scatter(X_reduced[:,0],X_reduced[:,1],c=y,s=50)
#ax.scatter(X_transformed[:,0],X_transformed[:,1],c=y,s=50)
ax.set_title("Truncated SVD reduction (2d) of transformed data (%dd)" %
             X_transformed.shape[1])
ax.set_xticks(())
ax.set_yticks(())

#为画彩色图作准备
h = .01
x_min, x_max = X[:, 0].min() - .5, X[:, 0].max() + .5
y_min, y_max = X[:, 1].min() - .5, X[:, 1].max() + .5
xx, yy = np.meshgrid(np.arange(x_min, x_max, h), np.arange(y_min, y_max, h))

transformed_grid = hasher.transform(np.c_[xx.ravel(), yy.ravel()])
y_grid_pred = nb.predict_proba(transformed_grid)[:, 1]

ax = plt.subplot(223)
ax.set_title("Naive Bayes on Transformed data")
ax.pcolormesh(xx, yy, y_grid_pred.reshape(xx.shape))
ax.scatter(X[:, 0], X[:, 1], c=y, s=50)
ax.set_ylim(-1.4, 1.4)
ax.set_xlim(-1.4, 1.4)
#去掉横纵坐标
ax.set_xticks(())
ax.set_yticks(())

y_grid_pred = trees.predict_proba(np.c_[xx.ravel(), yy.ravel()])[:, 1]

ax = plt.subplot(224)
ax.set_title("ExtraTrees predictions")
ax.pcolormesh(xx, yy, y_grid_pred.reshape(xx.shape))
ax.scatter(X[:, 0], X[:, 1], c=y, s=50)
ax.set_ylim(-1.4, 1.4)
ax.set_xlim(-1.4, 1.4)
ax.set_xticks(())
ax.set_yticks(())

plt.tight_layout()

plt.show()