7、监督学习--回归--非线性回归
1、什么是非线性回归?
1.1 非线性回归中有一个重要的概念:逻辑回归Logistic Regression
1.2 概率(P) probability:对一件事情发生的可能性的度量(0<=P<=1)
1.3 概率的计算方法:根据个人置信、根据历史数据、根据模拟数据
1.4 条件概率:P(A|B) = \frac{P(A∩B)}{P(B)},在B已经发生的情况下A发生的概率 = A和B同时发生的概率 / B发生的概率
2、逻辑回归Logistic Regression
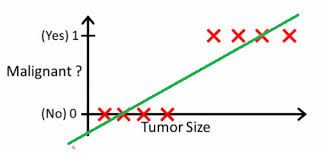
2.1 示例说明
h(x) > 0.5
h(x) > 0.2
2.2 基本模型
- 测试数据为X(x0,x1,x2···xn)
- 要学习的参数为: Θ(θ0,θ1,θ2,···θn)
Z = \theta_0x_0 + \theta_1x_1 + ... + \theta_nx_n
- 向量表示:Z = \Theta^TX
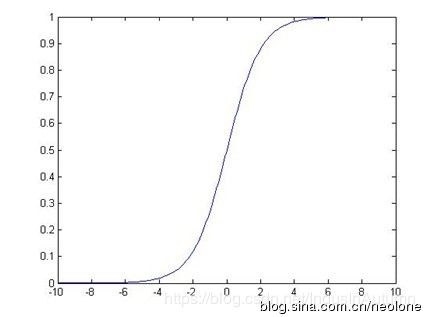
- 处理二值数据,引入Sigmoid函数时曲线平滑化
g(Z) = \frac{1}{1 + e^{-Z}}
2.3 预测函数
h_\theta(X) = g(\Theta^TX) = \frac{1}{1+e^{-\Theta^TX}}
用概率表示:
- 正例(y=1):h_\theta(X) = P(y=1 | X;\Theta)
- 反例(y=0):1 - h_\theta(X) = P(y=0 | X;\Theta)
2.4 Cost函数,线性回归
\sum_{i=1}^m = (h_\theta(x^{(i)}) - y^{(i)})^2
找到适合的θ_0,θ_1使上式最小:h_\theta(x^{(i)}) = \theta_0 + \theta_1x^{(i)}
综上,线性回归方程为:
Cost(h_{(\Theta)},y) = \left\{\begin{matrix}
-log(h_\Theta(X)) & when y = 1\\
-log(1-h_\Theta(X)) & when y = 0
\end{matrix}\right
J(\Theta) = \frac{1}{m} \sum_{i=1}^m Cost(h_\theta(x^{(i)}),y^{(i)}) = -\frac{1}{m} [ \sum_{i=1}^m (y^{(i)}log(h_\Theta(x^{(i)})) + (1 - y^{(i)})log(1 - h_\Theta(x^{(i)}))) ]
其中cost函数的目标为找到适合的θ_0,θ_1使上式最小。
PS:使用对数的好处是单调的,便于获取最小/最大值
PS:m表示样本数
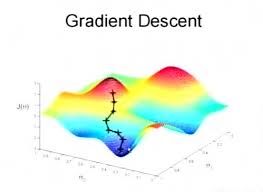
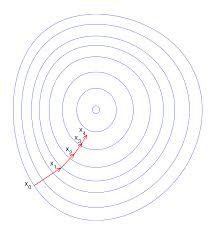
2.5 解法:梯度下降gradient decent
\theta_j = \theta_j - \alpha\frac{\partial}{\partial\theta_j}J(\theta), (j = 0...n)
更新法则:
\theta_j = \theta_j - \alpha\sum_{i = 1}^m (h_\theta(x^{(i)}) - y^{(i)})x_j^{(i)}, (j = 0...n)
学习率:同时对所有的θ进行更新,重复更新直到收敛
3、Python示例
import numpy as np
import random

# m denotes the number of examples here, not the number of features
# x:实例矩阵/特征集;y:向量/标签集;theta:带学习的参数值;alpha:学习率/步长;m:实例数;numIterations:学习率中重复次数/步数
def gradientDescent(x, y, theta, alpha, m, numIterations):
    # x矩阵转置
    xTrans = x.transpose()
    for i in range(0, numIterations):
        # x和theta的内积,即h_\theta
        hypothesis = np.dot(x, theta)
        # 更新法则中h_\theta - y
        loss = hypothesis - y
        # avg cost per example (the 2 in 2*m doesn't really matter here.
        # But to be consistent with the gradient, I include it)
        # 因为是通用cost函数,所以与之前定义的不相同,可以理解为线性模型中的目标函数的定义;PS:cost函数存在自由度,也可以改写为之前的定义
        cost = np.sum(loss ** 2) / (2 * m)
        print("Iteration %d | Cost: %f" % (i, cost))
        # avg gradient per example
        gradient = np.dot(xTrans, loss) / m
        # update
        theta = theta - alpha * gradient
    return theta

# numPoints:实例集;bias:偏移量;variance:方差,对数据离散度的衡量
def genData(numPoints, bias, variance):
    x = np.zeros(shape=(numPoints, 2))
    y = np.zeros(shape=numPoints)
    # basically a straight line
    for i in range(0, numPoints):
        # bias feature
        x[i][0] = 1
        x[i][1] = i
        # our target variable
        y[i] = (i + bias) + random.uniform(0, 1) * variance
    return x, y

# gen 100 points with a bias of 25 and 10 variance as a bit of noise
x, y = genData(100, 25, 10)
m, n = np.shape(x)
numIterations= 100000
alpha = 0.0005
theta = np.ones(n)
theta = gradientDescent(x, y, theta, alpha, m, numIterations)
print(theta)
PS:材料学习自麦子学院,如有雷同,纯属学习


