echart随窗口大小变化自适应(Vue)
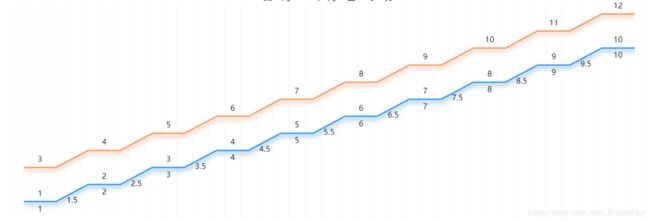
直入主题啦!效果图:

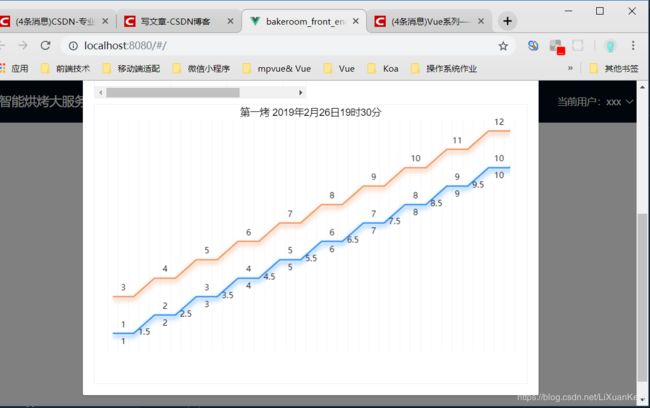
Vue中使用echart的教程很多,这里主要记录下自适应窗口大小变化,因为踩了很多坑,最终解决了,希望能帮助到大家(下面是缩小后的图)

其实就只要改几行代码:
- width换成百分比(height应该也OK)
- 随窗口大小调整(加在setOption之后;一定要加哦,否则是不会变的)
myChart.setOption(options);
window.onresize = myChart.resize;   //加这行代码,没错!
下面还有一些小建议
- 安装与按需加载
安装
npm install echarts -S
按需加载
//全局环境
let echarts = require("echarts/lib/echarts");
// 按需要引入折线图组件(其他的就不需要啦)
require("echarts/lib/chart/line");
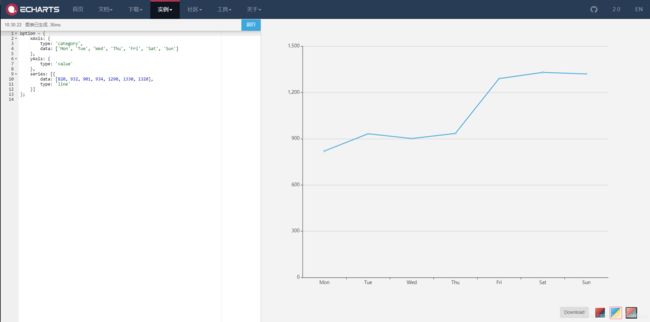
- 一个调试工具(不太熟悉echart的小伙伴试一试不错哦~网页上调试你的图表)
biu~
https://echarts.baidu.com/examples/editor.html?c=line-simple&theme=light

下面是我图表的option,有折线阴影,以及坐标轴和轴线的设置
{
		grid: {
			left: '3%',
			right: '3%',
			bottom: '5%',
			top:'-17.5%'
		},

		xAxis: {
			type: 'category',
			show: true,
			axisLine:{//axisLine决定是否显示坐标刻度
     show:false,
    lineStyle:{
            color: '#eeeeee',
          }
      },
axisLabel :{//决定是否显示数据
    show:false
},axisTick :{
    show:false
},
			splitLine: {
            show: true,
            lineStyle:{
            color: 'rgb(247,247,247)',
          }
		 },
			data: [0,1,2,3,4,5,6,7,8,9,0,1,2,3,4,5,6,7,8,9,1,2,3,4,5,6,7,8,9,0,1,2,3,4,5,6,7,8,9]
		},
		yAxis: {
		    show: true,

axisLine:{//axisLine决定是否显示坐标刻度
    show:true,
    lineStyle:{
            color: 'rgb(247,247,247)',
          }
      },
axisLabel :{//决定是否显示数据
    show:false
},axisTick :{
    show:false
},
          splitLine: {
            show: false,
            lineStyle:{
            color: '#ffffff',
          },
			type: 'value',

    },
		},
		series: [{
			data: [1,1,1,1.5,2,2,2,2.5,3,3,3,3.5,4,4,4,4.5,5,5,5,5.5,6,6,6,6.5,7,7,7,7.5,8,8,8,8.5,9,9,9,9.5,10,10,10,10.5],
			type: 'line',
			symbolSize: 0.01,
			label: {
					show: true,
					position: 'top',
						textStyle: {
                    color: 'black'
                  },
				formatter: function (params) {
                    if (params.dataIndex % 4 == 1) {
                      return params.data;
                    } else {
                      return '';
                    }
                  }
				},
				lineStyle: {
              color: 'white'
            }
		},{
			data: [1,1,1,1.5,2,2,2,2.5,3,3,3,3.5,4,4,4,4.5,5,5,5,5.5,6,6,6,6.5,7,7,7,7.5,8,8,8,8.5,9,9,9,9.5,10,10,10,10.5],
			type: 'line',
			symbolSize: 0.01,
			label: {
					show: true,
					position: 'bottom',
					textStyle: {
                    color: 'black'
                  },
				formatter: function (params) {
                    if (params.dataIndex % 2 == 1) {
                      return params.data;
                    } else {
                      return '';
                    }
                  }
				},
				lineStyle: {
               normal: {
                    color:'#3190f7',
                    width: 2,
                    shadowColor: '#3190f7',
                    shadowBlur: 10,
                    shadowOffsetY: 4
                }
            }
		},{
			 data: [3,3,3,3.5,4,4,4,4.5,5,5,5,5.5,6,6,6,6.5,7,7,7,7.5,8,8,8,8.5,9,9,9,9.5,10,10,10,10.5,11,11,11,11.5,12,12,12,12.5],
			type: 'line',
			symbolSize: 0.01,
			        label: {
					show: true,
					position: 'top',
						textStyle: {
                    color: 'black'
                  },
				formatter: function (params) {
                    if (params.dataIndex % 4 == 1) {
                      return params.data;
                    } else {
                      return '';
                    }
                  }
				}
			 ,
				lineStyle: {
                normal: {
                    color:'#ee9760',
                    width: 2,
                    shadowColor: '#ee9760',
                    shadowBlur: 10,
                    shadowOffsetY: 4
                }
            }
		}
		]
    }