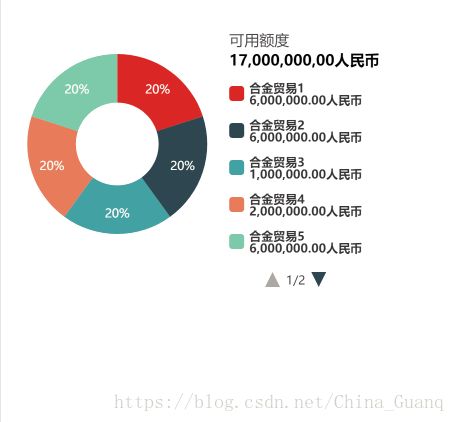
Echarts图表库。饼图 pie 图表组件的使用。饼图组件API使用规则--DOME
举例给予Echarts 图表 饼图的使用规则。更多内容参考:http://echarts.baidu.com/examples/#chart-type-pie
后端领前线,前端无极限。这里只举例了基于 Echarts 图表 “饼图” 的使用规则。更多内容参考官网网址,或者加入菜鸟Q群探讨问题以及学习:595377655。
<html>
	<head>
		<meta charset="UTF-8">
		<title>Echarts 示例title>
		<meta name="viewport" content="width=device-width,initial-scale=1,minimum-scale=1,maximum-scale=1,user-scalable=no" />
		<script src="js/echarts.common.min.js">script>
	head>
	<style type="text/css">
		html,body{
			margin: 0;
			padding: 0;
		}
		#main{
			height:360px;
			width: 100%;
		}
	style>
	<body>

    	<div id="main">div>
	body>
	<script type="text/javascript">
		var myChart = echarts.init(document.getElementById('main'));
		var option = {
			baseOption:{
				//调色盘颜色列表
//				color:['#015196','#0084f1', '#6abaff','#d6d6d6'],
				title:{		//标题组件,包含主标题和副标题。
					show:true,
					left:'48%',	//标题组件距离 图表组件走边的距离
					bottom:'80%',
					itemGap:5,
					text:'可用额度',
					textStyle:{
						color:'#464646',
						fontWeight:'normal',
						fontSize:15,
					},
					subtext:'17,000,000,00人民币',
					subtextStyle:{
						color:'#000000',
						fontSize:15,
						fontWeight:'bold',
					},
				},
			    tooltip: {		//提示框组件
			    	show:true,
			        trigger: 'item',
			        formatter:function(params) {
			        	console.log(params);
			        	//系列名称
			        	var seriesName = params.seriesName;
			        	//类目名称
			        	var name = params.name;
			        	//百分比
			        	var percent = params.percent;
			        	return seriesName+'
类别:'+name + '
' + '所占百分比例:'+percent+'%';

			        },
			    },
			    legend: {		//图例组件
			    	type:'scroll',
			    	left:'48%',		//图列组件距离 图表组件走边的距离 (% or px)
			    	top:'20%',
			        orient: 'vertical',
			        align:'left',
			        itemGap:13,
			        selectedMode:true,
			        itemWidth:15,
			        itemHeight:15,
			        height:210,		//图例组件的高度,设置指定高度确定显示图例出来的个数。
			        textStyle:{fontWeight:'bold',fontSize:12},
			        scrollDataIndex:0,
			        //默认选中,暂未实现
			        selected:genData().selected,
			        formatter:function(name) {
			        	var arrays = option.baseOption.series[0].data;
			        	for(var i = 0;i<arrays.length;i++) {
			        		//名称
			        		var type_name = arrays[i].name;
			        		//人民币占比
			        		var price = arrays[i].price;
			        		if(type_name == name) {
			        			return name+'\n'+price;
			        			break;
			        		}
			        	}
			        },
			        data:['合金贸易1','合金贸易2','合金贸易3','合金贸易4','合金贸易5','合金贸易6','合金贸易7'],
//			        data:['合金贸易1','合金贸易2','合金贸易3','合金贸易4'],
			    },
			    //图表系列组件
			    series: [
			        {
			        	type:'pie',
			            name:'图表详情',
			            center: ['25%','40%'],
                        radius: ['23%', '50%'],
			            //图形上的文本标签
			            label: {
			            	normal:{
			            		/**
				            	 * outside:饼图扇区外侧,通过视觉引导线连到相应的扇区。
				            	 * inside:饼图扇区内部。
				            	 * center:在饼图中心位置
				            	 */
				                position: 'inside',
				                formatter: '{d}%',
			            	},
			            },
			            data:[
			                {value:20, name:'合金贸易1',price:'6,000,000.00人民币'},
			                {value:20, name:'合金贸易2',price:'6,000,000.00人民币'},
			                {value:20, name:'合金贸易3',price:'1,000,000.00人民币'},
			                {value:20, name:'合金贸易4',price:'2,000,000.00人民币'},
			                {value:20, name:'合金贸易5',price:'6,000,000.00人民币'},
			                {value:20, name:'合金贸易6',price:'6,000,000.00人民币'},
			                {value:20, name:'合金贸易7',price:'6,000,000.00人民币'},
			            ]
			        },
			    ],
			},
			//针对移动端适应的参数的自定义调整
			//一般手机代表分辨率请参考
			media:[
				{
					query:{
						//小于等于240px时发生
						maxWidth:240,
					},
					option:{
						title:{
						},
						series:{
						},
						legend:{
						},
					}
				},
				{
					query:{
						//小于等于320px时发生
						maxWidth:320,
					},
					option:{
						title:{
						},
						series:{
						},
						legend:{
						},
					}
				}
			]

		}
		myChart.setOption(option);


		function genData() {
			return {
		        selected: {'合金贸易1':true,'合金贸易2':true,'合金贸易3':true,'合金贸易4':true,'合金贸易5':true,'合金贸易6':false,'合金贸易7':false}
		    };
		}
	script>
	html>

