arcgis-api-for-js-之 InfoTemplate 与 InfoWindow
1. 前言
InfoTemplate包含一个标题和内容模板字符串,用于将Graphic.attributes转换为HTML表示形式。可以使用Dojo语法的“${<关键字>}”执行参数替换。另外,可以使用通配符${*}作为模板字符串。通配符输出所有属性的名称值对。用户单击某图形后,默认的操是显示地图的信息窗口 InfoWindow。
InfoWindow 是一个HTML 弹出窗口,通常包含图形对象的属性,此外还可以使用它来显示地图中自定义的内容。下面的例子将显示如何使用自定义的更美观的窗口来代替 ArcGIS API 提供的信息窗口。
2. 实现代码
- 首先我们这里通过读取
JSON文件中的数据来添加图形。新建一个 json 文件,文件的结构如下:
{   identifier: "id",
    label: "street",
    items: [
    { id: "1",
     street:"24 Willie Mays Plz",
     city:"San Francisco",
     name:"AT&T Park",
     state:"CA",
     url:"http://sanfrancisco.giants.mlb.com/sf/ballpark/giantsenterprises/index.html",
     x:"-122.401029",
     y:"37.770945",
     zip:"94107"
     },
{ id: "2",
     street: "1 Pier 39",
     city: "San Francisco",
     name: "PIER 39",
     state: "CA",
     url: "http://www.pier39.com/",
     x: "-122.40910779",
     y: "37.8081332900002",
     zip: "94133"
     }
     ]
}
更多有关 dojo 的数据存储以及数据管理,可以参考 Dojo 官方的 API 中的dojo/store 数据存储模块,参考这个链接。如下图:

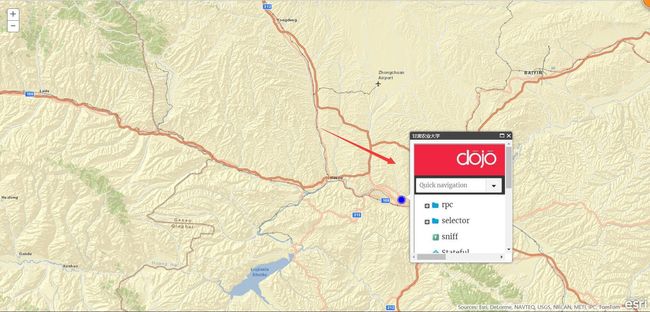
2. 默认的信息窗口
- 核心代码:
        var map;
        require(["dojo/parser", "esri/geometry/Extent", "esri/Color", "esri/map", "esri/layers/ArcGISTiledMapServiceLayer",
            "esri/geometry/Point", "esri/SpatialReference", "esri/graphic", "esri/InfoTemplate", "esri/symbols/SimpleMarkerSymbol", "esri/symbols/SimpleLineSymbol", "dojo/store/JsonRest", "dojo/domReady!"],
            function (parser, Extent, Color, Map, ArcGISTiledMapServiceLayer, Point, SpatialReference, Graphic, InfoTemplate, SimpleMarkerSymbol, SimpleLineSymbol, JsonRest) {
                parser.parse();
                //  创建一个显示的视图
                var extent = new Extent({
                    "xmin": 103.53154754638672, "ymin": 35.68379211425781,
                    "xmax": 103.32555389404297, "ymax": 36.82112121582031,
                    "spatialReference": { "wkid": 4326 }
                })
                map = new Map("mapDiv", {
                    extent: extent
                });
                var agoServiceURL = "http://server.arcgisonline.com/ArcGIS/rest/services/ESRI_StreetMap_World_2D/MapServer";
                var agoLayer = new ArcGISTiledMapServiceLayer(agoServiceURL);
                map.addLayer(agoLayer);
                //创建信息模板,读取JSON数据中的 name 值以及 url值
                var infoTemplate = new InfoTemplate("${name}", "${url}");
                //  设置 x , y 值构成的点的形状
                var symbol = new SimpleMarkerSymbol(
                  SimpleMarkerSymbol.STYLE_CIRCLE,
                  15,
                  new SimpleLineSymbol(
                    SimpleLineSymbol.STYLE_SOLID,
                    new Color([0, 0, 255, 0.5]),
                    8
                  ),
                  new Color([0, 0, 255])
                );

                //            地图加载完成后,执行addPointGraphics函数
                map.on("load", addPointGraphics);

                function addPointGraphics() {
                    // 使用 dojo/store 类的 JSONRest 方法读入数据
                    var store = new JsonRest({ target: "Data/PointData.json" });
                    // 利用store对象的query函数,首先获取id,然后读取 name 以及 url
                    store.query({ id: "*" }).then(function (result, request) {
                        var items = result.items;
                        for (var i = 0; i < items.length; i++) {
                            var attr = {
                                "name": items[i].name,
                                "url": items[i].url
                            };
                            // 根据获取的x y值构造点对象
                            var loc = new Point(items[i].x, items[i].y, new SpatialReference({ wkid: 4326 }));
                           // 构造图形
                            var graphic = new Graphic(loc, symbol, attr, infoTemplate);
                            // 将图形添加到地图中
                            map.graphics.add(graphic);
                        }
                    });
                    //  下面两句是执行鼠标移入以及移除触发显示信息窗口以及关闭信息窗口
                    map.graphics.on("mouse-over", g_onMouseOverHandler);
                    map.graphics.on("mouse-out", g_onMouseOutHandler);
                }
                //  鼠标移入显示信息窗口
                function g_onMouseOverHandler(evt) {
                    if (evt.graphic.attributes) {
                        map.infoWindow.setTitle(evt.graphic.attributes.name);
                        map.infoWindow.setContent(evt.graphic.attributes.url);
                        map.infoWindow.show(evt.screenPoint);
                    }
                }
                //  鼠标移除显示信息窗口
                function g_onMouseOutHandler(evt) {
                    map.infoWindow.hide();
                }
            }
        );
3.自定义信息窗口
- 核心代码:
var map, iTip;
require(["dojo/parser", "esri/geometry/Extent", "esri/Color", "esri/map", "esri/layers/ArcGISTiledMapServiceLayer",
"esri/geometry/Point", "esri/SpatialReference", "esri/graphic", "esri/InfoTemplate", "esri/symbols/SimpleMarkerSymbol", "esri/symbols/SimpleLineSymbol", "dojo/store/JsonRest", "dojo/domReady!"],
function (parser, Extent, Color, Map, ArcGISTiledMapServiceLayer, Point, SpatialReference, Graphic, InfoTemplate, SimpleMarkerSymbol, SimpleLineSymbol, JsonRest) {
parser.parse();
var extent = new Extent({
"xmin": -122.53154754638672, "ymin": 37.68379211425781,
"xmax": -122.32555389404297, "ymax": 37.82112121582031,
"spatialReference": { "wkid": 4326 }
})
map = new Map("mapDiv", {
extent: extent
});
var agoServiceURL = "http://server.arcgisonline.com/ArcGIS/rest/services/ESRI_StreetMap_World_2D/MapServer";
var agoLayer = new ArcGISTiledMapServiceLayer(agoServiceURL);
map.addLayer(agoLayer);
iTip = new InfoTip("i2Div", "infoTip white", map.position, true);
var infoTemplate = new InfoTemplate("${name}", "${url}");
var symbol = new SimpleMarkerSymbol(
SimpleMarkerSymbol.STYLE_CIRCLE,
15,
new SimpleLineSymbol(
SimpleLineSymbol.STYLE_SOLID,
new Color([0, 0, 255, 0.5]),
8),
new Color([0, 0, 255])
);
map.on("load", addPointGraphics);
function addPointGraphics() {
var store = new JsonRest({ target: "Data/PointData.json" });
store.query({ id: "*" }).then(function (result, request) {
var items = result.items;
for (var i = 0; i < items.length; i++) {
var attr = {
"name": items[i].name,
"url": items[i].url
};
var loc = new Point(items[i].x, items[i].y, new SpatialReference({ wkid: 4326 }));
var graphic = new Graphic(loc, symbol, attr, infoTemplate);
map.graphics.add(graphic);
}
});
map.graphics.on("mouse-over", g_onMouseOverHandler);
map.graphics.on("mouse-out", g_onMouseOutHandler);
}
function g_onMouseOverHandler(evt) {
if (evt.graphic.attributes) {
var img = ' ';
iTip.setContent(img + " " + evt.graphic.attributes.name);
iTip.show(evt.screenPoint);
}
}
function g_onMouseOutHandler(evt) {
iTip.hide();
}
}
);
';
iTip.setContent(img + " " + evt.graphic.attributes.name);
iTip.show(evt.screenPoint);
}
}
function g_onMouseOutHandler(evt) {
iTip.hide();
}
}
);3. 代码解析
- 在默认的信息窗口中,通过调用
addPointGraphics函数执行从JSON文件中读取数据,生成图形对象,并加入到地图中。
在该函数中首先创建一个dojo/store/JsonRest实例,然后调用该实例的query方法。
 var store = new JsonRest({ target: "Data/PointData.json" });
                    store.query({ id: "*" }).then(function (result, request) {
                    //  代码写在这里
                    }
其中 JsonRest 对象中的 target 属性用于所有请求到服务器的目标基本URL。该字符串将被预置为id以生成发送到服务器的请求的URL(相对或绝对)。
然后 query 方法查询存储数据的对象。这将触发对服务器的GET请求,将查询添加为查询字符串。它提供了类似 SQL 中的 select 语句功能,该方法将目标参数(由构造 JsonRest 实例时的 target 属性指定)与查询参数指定一个 Http Get 请求。例如我们上面的代码就是发送一个如下的请求:
http://localhost:28630/Infotetemplate/Data/PointData.json?id=*当从服务器得到数据响应后,针对每行记录,得到具体某个字段的值,根据 name 与 url 字段构造属性,根据 x ,y 坐标构造点对象,然后利用这些值构造图形对象,并加入到地图的图形图层中。由于在构造图形对象时,设置了信息模板,因此在程序运行后,用户单击加入的图形时,将自动弹出窗口,显示信息模板指定的标题与内容。也可以设置将鼠标移动到图形对象上时显示信息窗口,移除时关闭窗口,可以在addPointGraphics() 函数中加入下面的代码:
                    map.graphics.on("mouse-over", g_onMouseOverHandler);
map.graphics.on("mouse-out", g_onMouseOutHandler);其中,g_onMouseOverHandler 函数执行鼠标移到图形显示信息窗口,g_onMouseOutHandler 函数执行鼠标移出关闭信息窗口,代码如上。
2. 自定义信息窗口
首先新建一个 js 文件,用于定义一个信息窗口类 InfoTip 。下面代码为该类的声明以及基本的属性:
require(["dojo/_base/declare", "dojo/dom-construct", "dojo/dom-attr", "dojo/dom-style", "dojo/dom-geometry", "dojo/_base/window", "dojo/_base/fx"],
    function (declare, domConstruct, domAttr, domStyle, domGeom, win, fx) {
    declare("InfoTip", // 类名
        null, // 无父类,使用null
        {
            LOCATION: { left: "left", right: "right", top: "top", bottom: "bottom" },
            _isShowing: false,
            _position: null,
            _height: 0,
            _width: 0,
            _location: "top",
            _padding: 15,
            _xOffset: 0,
            _yOffset: 0,
            _id: "",
            _animationRef: null,

            constructor: function (divId, cssClass, mapPosition, useAnimation) {
                this._xOffset = mapPosition.x;
                this._yOffset = mapPosition.y;
                this._id = divId;
                this._animation = useAnimation;
                var a = domConstruct.create("div");
                domAttr.set(a, { id: divId, "class": cssClass, style: "display:none" });
                win.body().appendChild(a);
            },

            getId: function () {
                return this._id;
            },

            isShowing: function () {
                return this._isShowing;
            },
            // 设置属性
            setPadding: function (padding) {
                this._padding = padding;
            },

            setLocation: function (location) {
                this._location = location;
            },

            setSize: function (f, g) {
                domStyle.set(this._id, { height: g + "px", width: f + "px" })
            },

            setContent: function (f) {
                document.getElementById(this._id).innerHTML = f;
                domStyle.set(this._id, "display", "")
            },

            setClass: function (className) {
                document.getElementById(this._id).className = className;
            },
            //   显示方法
            show: function (g) {
                this._position = domGeom.position(this._id);
                this._height = this._position.h;
                this._width = this._position.w;

                var h, f;
                switch (this._location) {
                    case "left":
                        h = g.y + this._yOffset - (this._height / 2) + "px";
                        f = g.x + this._xOffset - this._width - this._padding + "px";
                        break;

                    case "right":
                        h = g.y + this._yOffset - (this._height / 2) + "px";
                        f = g.x + this._xOffset + this._padding + "px";
                        break;

                    case "bottom":
                        h = g.y + this._yOffset + this._padding + "px";
                        f = g.x + this._xOffset - (this._width / 2) + "px";
                        break;

                    case "top":
                        h = g.y + this._yOffset - this._height - this._padding + "px";
                        f = g.x + this._xOffset - (this._width / 2) + "px";
                        break
                }

                domStyle.set(this._id, { left: f, top: h, display: "" });
                if (this._animation) {
                    if (this._animationRef != null) {
                        this._animationRef.stop();
                    }

                    this._animationRef = fx.fadeIn({ node: this._id, duration: 1000 }).play();
                }
                this._isShowing = true;
            },

            hide: function () {
                if (!this._isShowing) {
                    return
                }

                if (this._animation) {
                    this._animationRef = fx.fadeOut({
                        node: this._id,
                        duration: 800,
                        onEnd: function () { this.node.style.display = "none" }
                    }).play();
                }
                else {
                    domStyle.set(this._id, "display", "none");
                }

                this._isShowing = false;
            }
        }
    );

});
有关类的声明以及继承可以参考我的这篇文章,在上面的类的构造函数中,除了参考设置属性外,还创建了用于容纳本信息窗口 DIV 的 ID,isShowing 用于判断是否已经显示信息窗口。该方法如下:
            //   显示方法
            show: function (g) {
                this._position = domGeom.position(this._id);
                this._height = this._position.h;
                this._width = this._position.w;

                var h, f;
                switch (this._location) {
                    case "left":
                        h = g.y + this._yOffset - (this._height / 2) + "px";
                        f = g.x + this._xOffset - this._width - this._padding + "px";
                        break;

                    case "right":
                        h = g.y + this._yOffset - (this._height / 2) + "px";
                        f = g.x + this._xOffset + this._padding + "px";
                        break;

                    case "bottom":
                        h = g.y + this._yOffset + this._padding + "px";
                        f = g.x + this._xOffset - (this._width / 2) + "px";
                        break;

                    case "top":
                        h = g.y + this._yOffset - this._height - this._padding + "px";
                        f = g.x + this._xOffset - (this._width / 2) + "px";
                        break
                }

                domStyle.set(this._id, { left: f, top: h, display: "" });
                if (this._animation) {
                    if (this._animationRef != null) {
                        this._animationRef.stop();
                    }

                    this._animationRef = fx.fadeIn({ node: this._id, duration: 1000 }).play();
                }
                this._isShowing = true;
            }
该方法首先通过传入点坐标计算信息窗口应该显示的位置,然后利用 domStyle.set 方法设置该位置,然后调用dojo/_base/fx::fadIn创建一个淡入动画对象,并执行该动画对象。
影藏信息窗口的方法如下:
            hide: function () {
                if (!this._isShowing) {
                    return
                }

                if (this._animation) {
                    this._animationRef = fx.fadeOut({
                        node: this._id,
                        duration: 800,
                        onEnd: function () { this.node.style.display = "none" }
                    }).play();
                }
                else {
                    domStyle.set(this._id, "display", "none");
                }

                this._isShowing = false;
}在上述的方法中,如果指定使用动画效果,则调用dojo/_base/fx::fadeOut 创建一个淡出动画对象,并执行;如果不使用动画效果,则直接使用 domStyle.set 将信息窗口中的 display 属性设置为 none,将实现影藏目的。然后在网页中调用我们定义的 InfoTip 类。
4. 实现效果
- 默认信息窗口
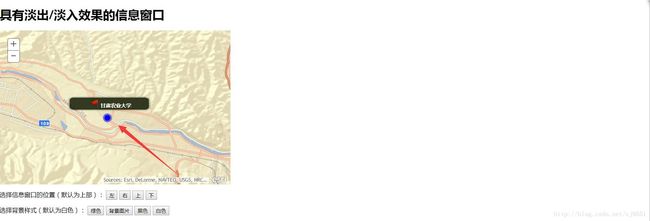
- 自定义信息窗口
参考链接:
https://developers.arcgis.com/javascript/3/jsapi/infotemplate-amd.html
https://developers.arcgis.com/javascript/3/jsapi/infowindow-amd.html