将后台数据如何展示成各种图形样式,如柱状图/折线图/饼状图
更多样式的图形请看此网站:
http://echarts.baidu.com/examples/#chart-type-funnel
先给个容器
![]()
接入echarts.min.js(最重要的)(同样也在上方的网站里下载)
![]()
然后把要展示的数据传到js中
// 基于准备好的dom,初始化echarts实例
var myChart = echarts.init(document.getElementById('main'));
// 指定图表的配置项和数据
function getdata(cardTime,Success,Error,Max){
var option = {
title: {
text: '活动统计',
subtext: ''
},
tooltip: {
trigger: 'axis'
},
legend: {
data:['成功人数','失败人数']
},
toolbox: {
show: true,
feature: {
dataZoom: {
yAxisIndex: 'none'
},
dataView: {readOnly: false},
magicType: {type: ['line', 'bar']},
restore: {},
saveAsImage: {}
}
},
xAxis: {
type: 'category',
boundaryGap: false,
// data: ['周一','周二','周三','周四','周五','周六','周日']
data:cardTime
},
yAxis: {
type: 'value',
splitNumber:1,
min: 0,
max:Max+100
},
series: [
{
name:'成功人数',
type:'line',
data:Success,
markPoint: {
data: [
{type: 'max', name: '最大值'},
{type: 'min', name: '最小值'}
]
},
markLine: {
data: [
{type: 'average', name: '平均值'}
]
}
},
{
name:'失败人数',
type:'line',
data:Error,
markPoint: {
data: [
{name: '最低', value: -2, xAxis: 1, yAxis: -1.5}
]
},
markLine: {
data: [
{type: 'average', name: '平均值'},
[{
symbol: 'none',
x: '90%',
yAxis: 'max'
}, {
symbol: 'circle',
label: {
normal: {
position: 'start',
formatter: '最大值'
}
},
type: 'max',
name: '最高点'
}]
]
}
}
]
};
//使用刚指定的配置项和数据显示图表。
myChart.setOption(option);
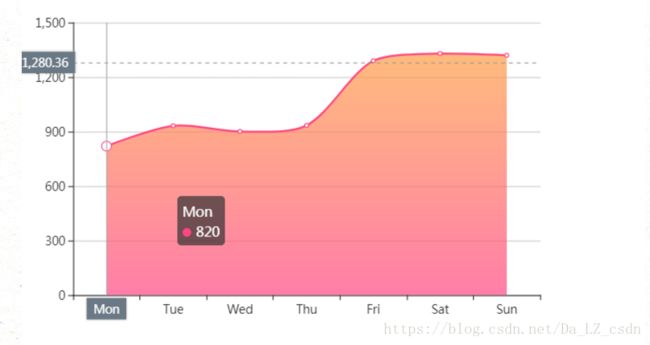
如果给曲线图下方带颜色
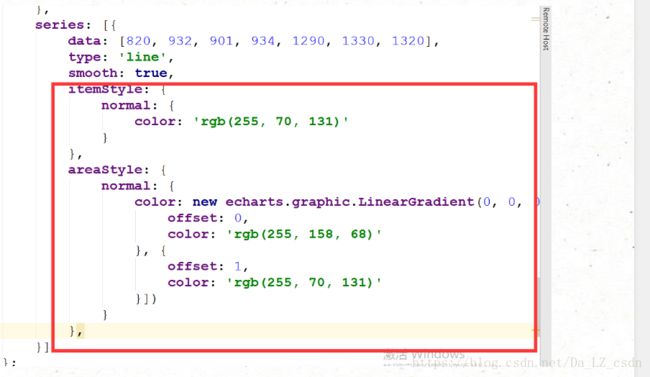
需要在series里加上这个
series: [{
data: [820, 932, 901, 934, 1290, 1330, 1320],
type: 'line',
smooth: true,
itemStyle: {
normal: {
color: 'rgb(255, 70, 131)'
}
},
areaStyle: {
normal: {
color: new echarts.graphic.LinearGradient(0, 0, 0, 1, [{
offset: 0,
color: 'rgb(255, 158, 68)'
}, {
offset: 1,
color: 'rgb(255, 70, 131)'
}])
}
},
}]
折线图/柱状图切换下载
加上这段:
toolbox: {
show: true,
feature: {
dataZoom: {
yAxisIndex: 'none'
},
dataView: {readOnly: false},
magicType: {type: ['line', 'bar']},
restore: {},
saveAsImage: {}
}
},


