线性回归-task4
Linear Regression-task4
- 1. 波士顿房产数据(完整数据)
- 2. 实现多变量(手写代码)
- 3. 数据标准化(手写代码)
- 4. 网格搜索调参
1. 波士顿房产数据(完整数据)
import pandas as pd
import numpy as np
#特征转DataFrame格式
boston_X = pd.DataFrame(bostonDatas.data,columns = bostonDatas.feature_names)
print(boston_X.head())

#结果转DataFrame
boston_y = pd.DataFrame(bostonDatas.target,columns=['housePrice'])#【注意加列名要加在[]中】
print(boston_y.head())

#合并DataFrame
boston_all = pd.concat([boston_X,boston_y],axis =1)#axis =1 为横向操作,即横向合并
2. 实现多变量(手写代码)
#计算损失
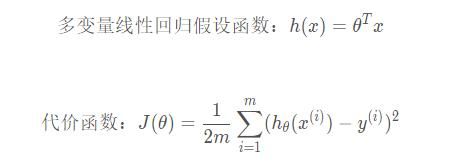
def computeCost(X, y, theta):
    m = y.shape[0]
#     J = (np.sum((X.dot(theta) - y)**2)) / (2*m)
    C = X.dot(theta) - y
    J2 = (C.T.dot(C))/ (2*m)
    return J2

#梯度下降
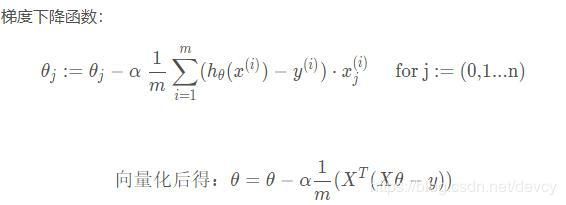
def gradientDescent(X, y, theta, alpha, num_iters):
    m = y.shape[0]
    #print(m)
    # 存储历史误差
    J_history = np.zeros((num_iters, 1))
    for iter in range(num_iters):
        # 对J求导,得到 alpha/m * (WX - Y)*x(i), (3,m)*(m,1)  X (m,3)*(3,1) = (m,1)
        theta = theta - (alpha/m) * (X.T.dot(X.dot(theta) - y))
        J_history[iter] = computeCost(X, y, theta)
    return J_history,theta
3. 数据标准化(手写代码)
#特征缩放
def featureNormalize(X):
    X_norm = X;
    mu = np.zeros((1,X.shape[1]))
    sigma = np.zeros((1,X.shape[1]))
    for i in range(X.shape[1]):
        mu[0,i] = np.mean(X[:,i]) # 均值
        sigma[0,i] = np.std(X[:,i])     # 标准差
#     print(mu)
#     print(sigma)
    X_norm  = (X - mu) / sigma
    return X_norm,mu,sigma
- 数据标准化例子
from sklearn import preprocessing
import numpy as np

x = np.array([[1., -1., 2., 3.],
              [2., 0., 0., -2],
              [0., 1., -1., 0],
              [1., 2., -3., 1]])

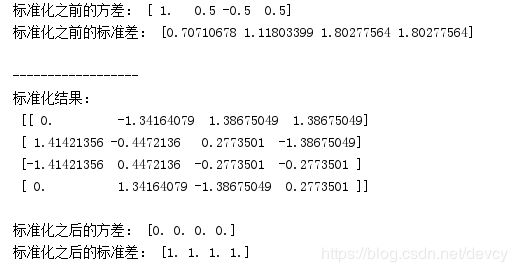
print("标准化之前的方差:", x.mean(axis=0))
print("标准化之前的标准差:", x.std(axis=0))

#标准化
x_scale = preprocessing.scale(x)
print("\n------------------\n标准化结果:\n", x_scale)
print("\n标准化之后的方差:", x_scale.mean(axis=0))
print("标准化之后的标准差:", x_scale.std(axis=0))
4. 网格搜索调参
Grid Search:一种调参手段;穷举搜索:在所有候选的参数选择中,通过循环遍历,尝试每一种可能性,表现最好的参数就是最终的结果。其原理就像是在数组里找最大值。(为什么叫网格搜索?以有两个参数的模型为例,参数a有3种可能,参数b有4种可能,把所有可能性列出来,可以表示成一个3*4的表格,其中每个cell就是一个网格,循环过程就像是在每个网格里遍历、搜索,所以叫grid search)
- 波士顿数据集
x_train,x_test,y_train,y_test = train_test_split(bostonStd_1[:,[0,13]],bostonStd_1[:,[13]],test_size=0.3,random_state=0)
#k近邻网络搜索来进行调参
from sklearn.grid_search import GridSearchCV
from sklearn.neighbors import KNeighborsRegressor

knn_reg = KNeighborsRegressor()
grid_param = [
    {
        'weights':['uniform'],
        'n_neighbors':[i for i in range(1,11)]
    },
    {
        'weights':['distance'],
        'n_neighbors':[i for i in range(1,11)],
         'p':[i for i in range(1,6)]
    }
]
knn_reg = KNeighborsRegressor()
grid_search = GridSearchCV(knn_reg,grid_param,n_jobs=-1,verbose=2,cv=10)
# 调用fit方法执行网格搜索
grid_search.fit(x_train,y_train.astype('int'))

print(grid_search.best_params_)
print(grid_search.best_score_)
print(grid_search.best_estimator_.score(x_test,y_test))
参考文献
https://www.cnblogs.com/xiaoqi/p/6408614.html
https://blog.csdn.net/qq_33182424/article/details/82877671


