Python画图分析2018北京中考数据----达到各分数段的考生百分比
数据来源:北京教育考试院 2018年北京市中考各区分数段人数统计
把里面各区的数据下载整理到了本地excel
#!/usr/bin/env python
#  -*- coding:utf-8 -*-
from xlrd import open_workbook as owb
import matplotlib.pyplot as plt
from matplotlib.ticker import MultipleLocator, FormatStrFormatter, FuncFormatter
import numpy as np
x_data=[]       # 存储各区的数据,是个2维list
y_data=[]       # 分数线
y_data1=[]      # 备用
districts=[]    # 存储各区名称 西城 东城等
data_index = 0  # x_data的一维下标

wb = owb('2018data.xlsx')   # 数据文件
table_base = wb.sheets()[0] # 读第一页当作base
active_districts = ['东城','西城','朝阳','海淀','房山','大兴','昌平'] ## 填写需要画哪些区的,名字需要与表格内一致

def my_formatter(x, pos):
    '''
    The two args are the value and tick position
    自定义的格式转换函数
    '''
    if x < 400:
        return '400以下'
    elif x > 570:
        return '570以上'
    return int(x)

for row in range(1, table_base.nrows):  ## Y轴数据
    tmp = int(table_base.cell(row, 0).value)
    y_data.append(tmp)
    y_data1.append(row)

for s in wb.sheets():
    print ('Sheet: ', s.name)
    '以下两行用于控制是否全部绘图,还是只绘选择的区'
    if s.name not in active_districts:
        continue
    districts.append(s.name)
    x_data.append([])
    raw_student=[]
    for row in range(1,s.nrows):
       raw_student.append(int(s.cell(row, 2).value))
    total_student = int(raw_student[-1])

    for i in range(len(raw_student)):
        tmp = round(100*raw_student[i]/total_student,3)  #求百分比并取3位小数
        #raw_student[i] = tmp
        x_data[data_index].append(tmp)   ## 存储x轴数据
    data_index += 1


## 画图部分 ##
plt.rcParams['font.sans-serif']=['SimHei']
plt.rcParams['axes.unicode_minus']=False

figsize = 11,14
figure, ax = plt.subplots(figsize=figsize)
print(y_data)
print(y_data1)
for i in range(0, data_index):
    print('Ploting ', i, ' District ', districts[i])
    plt.plot(x_data[i], y_data, label=districts[i])

#X轴
ax.set_xlim(0,100)  # x轴范围
xmajorLocator = MultipleLocator(10) # x轴显示的倍数
ax.xaxis.set_major_locator(xmajorLocator)
plt.xlabel(u'占本区所有考生的百分比 %')
ax.xaxis.grid(True, which='major') #显示主要网格

#Y轴
#plt.yticks(np.arange(len(y_data)),y_data)
#plt.yticks(y_data1, y_data)
#plt.yticks(np.arange(0, len(y_data), step=20))
ymajorLocator = MultipleLocator(10)
ax.yaxis.set_major_locator(ymajorLocator)
plt.ylabel(u"中考总分(含加分)")
ax.yaxis.grid(True, which='major')
#locs, labels = plt.yticks()
#for i in range(0,10):
    #print (locs[i],',,,', labels[i])
ax.yaxis.set_major_formatter( FuncFormatter( my_formatter )) ## 设置标签格式

plt.title('2018中考--各区成绩百分比统计',fontsize=18)
plt.legend()
plt.savefig('testfigure.png')
plt.show()
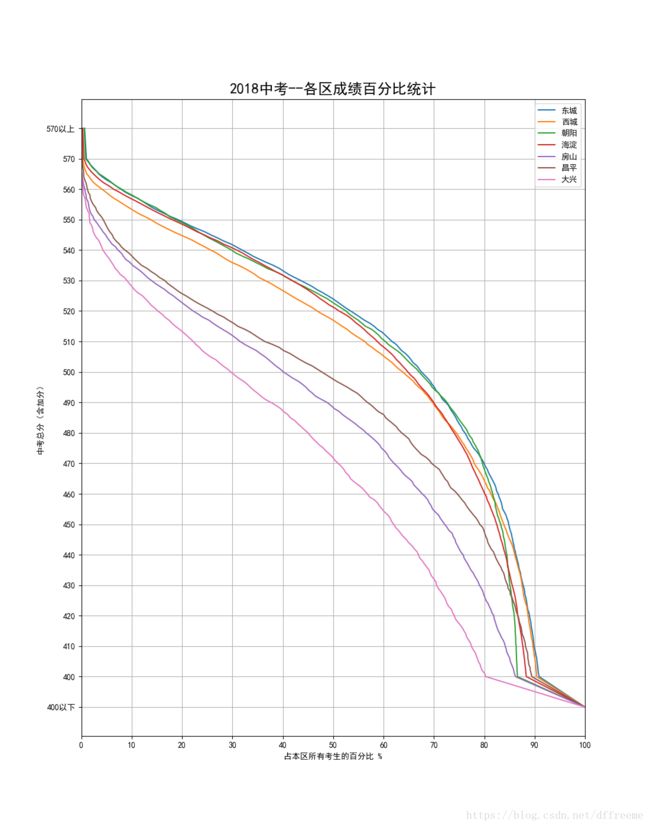
上图是筛选出了几个区县的数据,简单解释一下表格的含义
Y轴表示中考分数(含加分)
X轴表示达到或超过此分数线的学生人数占本区所有考生的比例
以X轴10%为例,可以看出大兴区前10%的考生成绩在大约529分以上,而朝阳区前10%的考生成绩在568分以上
以Y轴500分为例,可以看出:如果考500分,在房山区的所有学生中能排到前40%,而在海淀区只能排在前65%左右
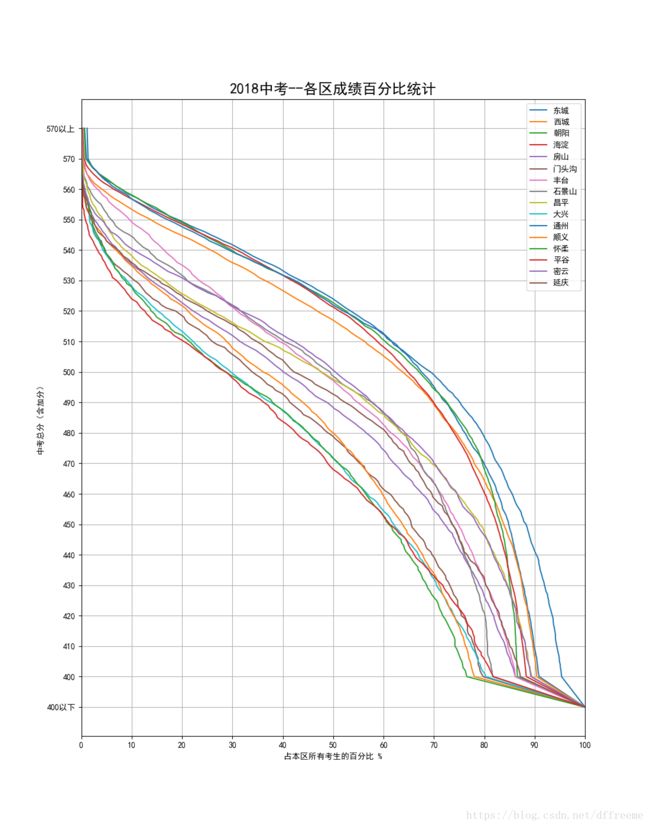
也就是说,曲线越靠上方的,说明该区的总体考生成绩越好
下图是列出了所有区县的(燕山地区除外,总共才300+人,没有进行统计)

