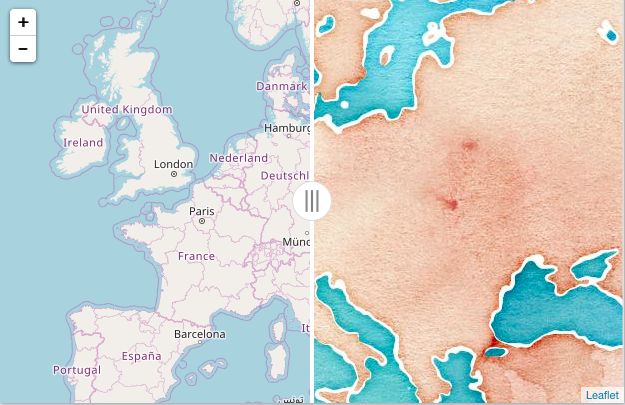
Leaflet side by side
library(leaflet)
library(htmltools)
library(htmlwidgets)

LeafletSideBySidePlugin <- htmlDependency("leaflet-side-by-side","2.0.0",
                                          src = c(href="https://github.com/digidem/leaflet-side-by-side"),
                                          script="leaflet-side-by-side.js")

registerPlugin <- function(map, plugin) {
  map$dependencies <- c(map$dependencies, list(plugin))
  map
}

leaflet() %>%
 registerPlugin(LeafletSideBySidePlugin) %>%
  onRender("
           function(el, x) {
           var mylayer1 = L.tileLayer(
           'http://{s}.tile.openstreetmap.org/{z}/{x}/{y}.png',{
           maxZoom: 18
           }).addTo(this);
           var mylayer2 = L.tileLayer(
           '//stamen-tiles-{s}.a.ssl.fastly.net/watercolor/{z}/{x}/{y}.png',{
           maxZoom: 14
           }).addTo(this);
           L.control.sideBySide(mylayer1, mylayer2).addTo(this);
           this.setView([50, 12], 4);
          } ")
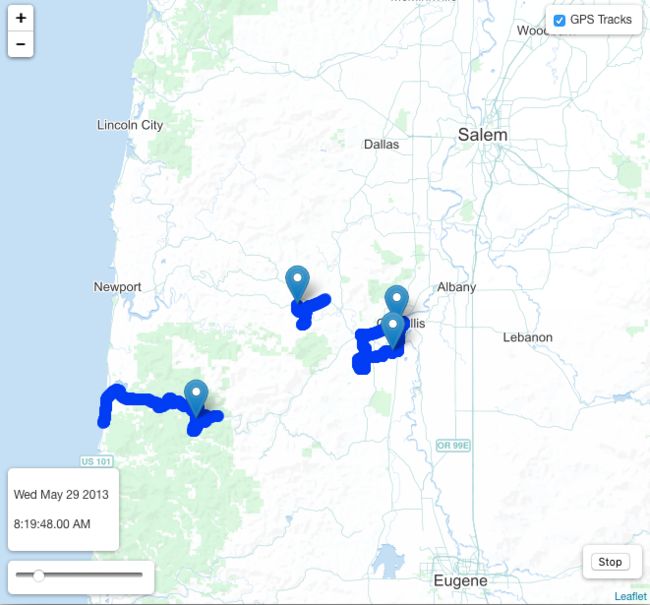
Leaflet Playback
library(leaflet)
library(htmltools)
library(htmlwidgets)


LeafletPlaybackPlugin <-
  htmlDependency(
    "LeafletPlayback",
    "1.0.0",
    src = c(href = "http://leafletplayback.theoutpost.io/"),
    script = c("dist/LeafletPlayback.js", "data/demo/demo-tracks.js")
  )


registerPlugin <- function(map, plugin) {
  map$dependencies <- c(map$dependencies, list(plugin))
  map
}

leaflet() %>%
  registerPlugin(LeafletPlaybackPlugin) %>%
  onRender(
    "
    function(el, x) {
      var basemapLayer = L.tileLayer('http://{s}.tiles.mapbox.com/v3/github.map-xgq2svrz/{z}/{x}/{y}.png').addTo(this);
      this.setView([44.61131534, -123.4726739], 9);
      var playbackOptions = {
        playControl: true,
        dateControl: true,
        sliderControl: true
      };
      var playback = new L.Playback(this, demoTracks, null, playbackOptions);
    } "
)
Proj4Leaflet
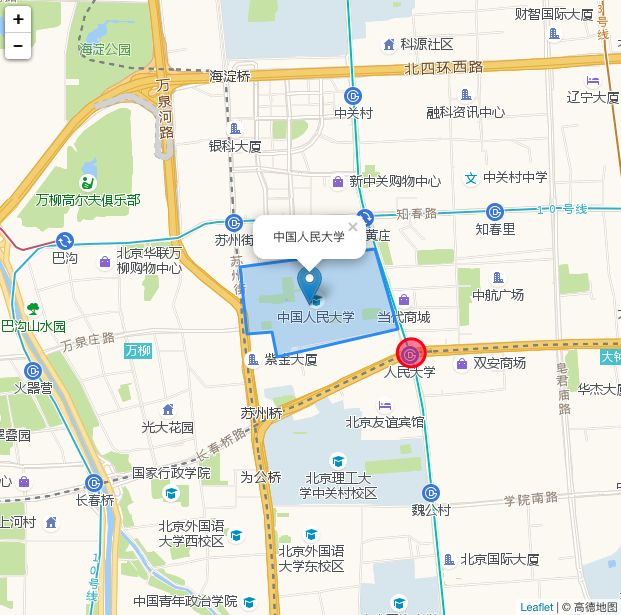
高德地图
library(leaflet)
library(htmltools)
library(htmlwidgets)

LeafletPlugin <-
  htmlDependency(
    "Leaflet",
    "1.0.3",
    src = c(href = "https://unpkg.com/[email protected]/dist/"),
    script = c("leaflet.js"),
    stylesheet = c("leaflet.css")
  )

Proj4LeafletPlugin <-
  htmlDependency(
    "Proj4Leaflet",
    "1.0.1",
    src = c(file = "~/Downloads/Proj4Leaflet-1.0.1/"),
    script = c("lib/proj4-compressed.js", "src/proj4leaflet.js")
  )

registerPlugin <- function(map, plugin) {
  map$dependencies <- c(map$dependencies, list(plugin))
  map
}

leaflet() %>%
  registerPlugin(LeafletPlugin) %>%
  registerPlugin(Proj4LeafletPlugin) %>%
  onRender(
    "
    function(el, x) {
    var get_resolution = function() {
    level = 19;
    var res = [];
    res[0] = Math.PI * 2 * 6378137 / 256;
    for(var i = 1 ; i < level; i++) {
    res[i] = Math.PI * 2 * 6378137 / 256 / Math.pow(2, i);
    }
    return res;
    };

    var crs = new L.Proj.CRS('EPSG:3857',
    '+proj=merc +a=6378137 +b=6378137 +lat_ts=0.0 +lon_0=0.0 +x_0=0.0 +y_0=0 +k=1.0 +units=m +nadgrids=@null +no_defs',
    {
    resolutions: get_resolution(),
    origin: [-Math.PI * 2 * 6378137 / 2.0, Math.PI * 2 * 6378137 / 2.0],
    bounds: L.bounds([-20037508.342789244, 20037508.342789244], [20037508.342789244, -20037508.342789244])
    }
    );

    this.options.crs = crs;
    this.setView([39.970096, 116.31267], 14);

    L.tileLayer('http://webrd0{s}.is.autonavi.com/appmaptile?lang=zh_cn&size=1&scale=1&style=8&x={x}&y={y}&z={z}', {
    attribution: '© 高德地图 © CSP',
    maxZoom: 18,
    minZoom: 3,
    subdomains: '1234'
    }).addTo(this);

    var marker = L.marker([39.970096, 116.31267]).addTo(this);

    var circle = L.circle([39.967, 116.321464], {
    color: 'red',
    fillColor: '#f03',
    fillOpacity: 0.5,
    radius: 100
    }).addTo(this);

    var polygon = L.polygon([
    [39.972657, 116.306744],
    [39.973825, 116.318352],
    [39.968579, 116.320348],
    [39.966753, 116.30992],
    [39.968398, 116.30949],
    [39.96825, 116.307345]
    ]).addTo(this);

    marker.bindPopup('中国人民大学').openPopup();
    circle.bindPopup('人民大学地铁站');
    polygon.bindPopup('人民大学校园');

    function onMapClick(e) {
    alert('你点击位置是:' + e.latlng);
    }

    this.on('click', onMapClick);
  }")
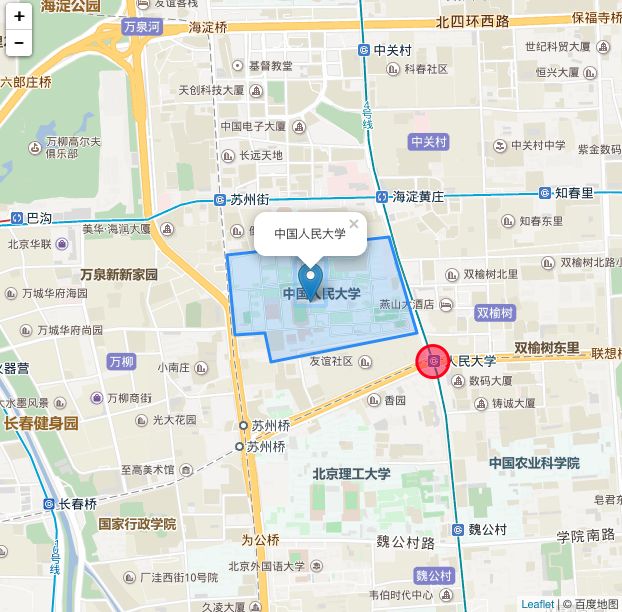
百度地图
library(leaflet)
library(htmltools)
library(htmlwidgets)

LeafletPlugin <-
  htmlDependency(
    "Leaflet",
    "1.0.3",
    src = c(href = "https://unpkg.com/[email protected]/dist/"),
    script = c("leaflet.js"),
    stylesheet = c("leaflet.css")
  )

Proj4LeafletPlugin <-
  htmlDependency(
    "Proj4Leaflet",
    "1.0.1",
    src = c(file = "~/Downloads/Proj4Leaflet-1.0.1/"),
    script = c("lib/proj4-compressed.js", "src/proj4leaflet.js")
  )

registerPlugin <- function(map, plugin) {
  map$dependencies <- c(map$dependencies, list(plugin))
  map
}

leaflet() %>%
  registerPlugin(LeafletPlugin) %>%
  registerPlugin(Proj4LeafletPlugin) %>%
  onRender(
    "
    function(el, x) {
    var convertCoors = function (inputCoors) {
    var x_pi = 3.14159265358979324 * 3000.0 / 180.0;
    var x = inputCoors[1];
    var y = inputCoors[0];
    var z = Math.sqrt(x * x + y * y) + 0.00002 * Math.sin(y * x_pi);
    var theta = Math.atan2(y, x) + 0.000003 * Math.cos(x * x_pi);
    var bmap_lon = z * Math.cos(theta) + 0.0065;
    var bmap_lat = z * Math.sin(theta) + 0.006;
    return [bmap_lat, bmap_lon];
    };

    var get_resolution = function() {
    level = 19;
    var res = [];
    res[0] = Math.pow(2, 18);
    for(var i = 1 ; i < level; i++) {
    res[i] = Math.pow(2, (18 - i));
    }
    return res;
    };

    var crs = new L.Proj.CRS('BDProj',
    '+proj=merc +a=6378206.4 +b=6356583.8 +lat_ts=0.0 +lon_0=0.0 +x_0=0 +y_0=0 +k=1.0 +units=m +nadgrids=@null +no_defs',
    {
    resolutions: get_resolution(),
    origin: [0, 0],
    bounds: L.bounds([0, 20037508.342789244], [20037508.342789244, 0])
    });

    this.options.crs = crs;
    this.setView(convertCoors([39.970096, 116.31267]), 14);

    L.tileLayer('http://online{s}.map.bdimg.com/tile/?qt=tile&x={x}&y={y}&z={z}&styles=pl&scaler=1&udt=20170406', {
    attribution: '© 百度地图 © CSP',
    maxZoom: 19,
    minZoom: 3,
    subdomains: '1234',
    tms: true
    }).addTo(this);

    var marker = L.marker(convertCoors([39.970096, 116.31267])).addTo(this);

    var circle = L.circle(convertCoors([39.967, 116.321464]), {
    color: 'red',
    fillColor: '#f03',
    fillOpacity: 0.5,
    radius: 100
    }).addTo(this);

    var polygon = L.polygon([
    convertCoors([39.972657, 116.306744]),
    convertCoors([39.973825, 116.318352]),
    convertCoors([39.968579, 116.320348]),
    convertCoors([39.966753, 116.30992]),
    convertCoors([39.968398, 116.30949]),
    convertCoors([39.96825, 116.307345])
    ]).addTo(this);

    marker.bindPopup('中国人民大学').openPopup();
    circle.bindPopup('人民大学地铁站');
    polygon.bindPopup('人民大学校园');

    function onMapClick(e) {
    alert('你点击位置是:' + e.latlng);
    }

    this.on('click', onMapClick);
    }"
)


