numpy摘抄
1.
为了创建数字序列,NumPy提供了一个类似于range返回数组而不是列表的函数 。
>>> np.arange( 10, 30, 5 )
array([10, 15, 20, 25])当arange与浮点参数一起使用时,由于有限的浮点精度,通常不可能预测所获得的元素的数量。出于这个原因,通常最好使用linspace作为参数接收我们想要的元素数量的函数,而不是步骤:
>>>
>>> from numpy import pi
>>> np.linspace( 0, 2, 9 )                 # 9 numbers from 0 to 2
array([ 0.  ,  0.25,  0.5 ,  0.75,  1.  ,  1.25,  1.5 ,  1.75,  2.  ])
2.
一维数组可以被索引,切片和迭代,就像 列表 和其他Python序列一样。
3.
>>> a = np.arange(12).reshape(3,4)
>>> b = a > 4
>>> b                                          # b is a boolean with a's shape
array([[False, False, False, False],
       [False,  True,  True,  True],
       [ True,  True,  True,  True]])
>>> a[b] = 0 # All elements of 'a' higher than 4 become 0
>>> a
array([[0, 1, 2, 3],
[4, 0, 0, 0],
[0, 0, 0, 0]])4.
You can look at the following example to see how to use boolean indexing to generate an image of the Mandelbrot set:
>>>
>>> import numpy as np
>>> import matplotlib.pyplot as plt
>>> def mandelbrot( h,w, maxit=20 ):
...     """Returns an image of the Mandelbrot fractal of size (h,w)."""
...     y,x = np.ogrid[ -1.4:1.4:h*1j, -2:0.8:w*1j ]
...     c = x+y*1j
...     z = c
...     divtime = maxit + np.zeros(z.shape, dtype=int)
...
...     for i in range(maxit):
...         z = z**2 + c
...         diverge = z*np.conj(z) > 2**2            # who is diverging
...         div_now = diverge & (divtime==maxit)  # who is diverging now
...         divtime[div_now] = i                  # note when
...         z[diverge] = 2                        # avoid diverging too much
...
...     return divtime
>>> plt.imshow(mandelbrot(400,400))
>>> plt.show()
5.
直方图
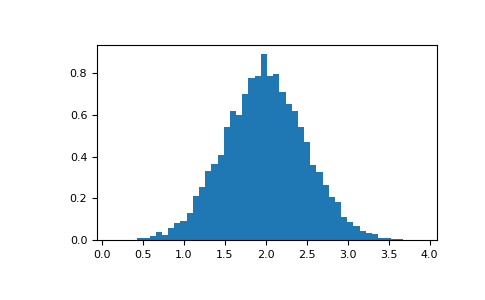
histogram应用于数组的NumPy 函数返回一对向量:数组的直方图和bin的向量。注意: matplotlib还有一个构建直方图的功能(hist在Matlab中称为),与NumPy中的直方图不同。主要区别在于pylab.hist自动绘制直方图,而 numpy.histogram只生成数据。
>>>
>>> import numpy as np
>>> import matplotlib.pyplot as plt
>>> # Build a vector of 10000 normal deviates with variance 0.5^2 and mean 2
>>> mu, sigma = 2, 0.5
>>> v = np.random.normal(mu,sigma,10000)
>>> # Plot a normalized histogram with 50 bins
>>> plt.hist(v, bins=50, density=1)       # matplotlib version (plot)
>>> plt.show()
>>>
>>> # Compute the histogram with numpy and then plot it
>>> (n, bins) = np.histogram(v, bins=50, density=True)  # NumPy version (no plot)
>>> plt.plot(.5*(bins[1:]+bins[:-1]), n)
>>> plt.show()
