【Python那些事儿】为多变量数据绘制散点图
准备工作
在分析多变量数据时,我们更关注这些变量之间是否存在某些联系。
- 无相关
- 强相关
- 简单关联
- 多元(非简单)关联
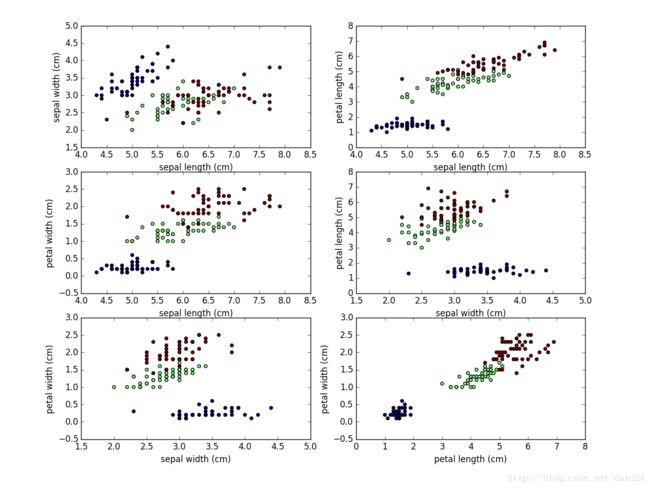
本实验使用iris数据集。iris数据集有150个实例(3类鸢尾花各50条记录)和4种属性(花萼长度、宽度和花瓣长度、宽度)。
操作方法
#导入相关库
from sklearn.datasets import load_iris
import numpy as np
import matplotlib.pyplot as plt
import itertools

if __name__ == '__main__':

    data = load_iris()#加载数据,data字典对象
    x = data['data']
    y = data['target']
    col_name = data['feature_names']#列名

    plt.close('all')
    plt.figure(1)
    subplot_start = 321#绘制一个3行2列的图
    col_numbers = xrange(0, 4)
    col_pairs = itertools.combinations(col_numbers, 2)#后文详细介绍
    #plt.subplots_adjust(wspace=0.5)

    for i in col_pairs:
        plt.subplot(subplot_start)
        plt.scatter(x[:,i[0]], x[:,i[1]], c=y)#参数c为点设置颜色,不同类别花的点颜色不同
        plt.xlabel(col_name[i[0]])
        plt.ylabel(col_name[i[1]])

        subplot_start += 1
    plt.show()
输出:

如上图,我们绘除了列的两两组合,用不同的颜色表示不同的类标签。
补充:
permutations(排列)和combinations(组合)的区别:
import itertools

if __name__ == '__main__':
    print list(itertools.permutations([0, 1, 2, 3], 2)) #排列
    print list(itertools.combinations([0, 1, 2, 3], 2)) #组合


----------
输出:
[(0, 1), (0, 2), (0, 3), (1, 0), (1, 2), (1, 3), (2, 0), (2, 1), (2, 3), (3, 0), (3, 1), (3, 2)]
[(0, 1), (0, 2), (0, 3), (1, 2), (1, 3), (2, 3)]