【Python数据挖掘课程】四.决策树DTC数据分析及鸢尾数据集分析
1.分类及决策树算法介绍
2.鸢尾花卉数据集介绍
3.决策树实现鸢尾数据集分析
前文推荐:
【Python数据挖掘课程】一.安装Python及爬虫入门介绍
【Python数据挖掘课程】二.Kmeans聚类数据分析及Anaconda介绍
【Python数据挖掘课程】三.Kmeans聚类代码实现、作业及优化
希望这篇文章对你有所帮助, 尤其是刚刚接触数据挖掘以及大数据的同学,同时准备尝试以案例为主的方式进行讲解。如果文章中存在不足或错误的地方,还请海涵~
一. 分类及决策树介绍
1.分类
分类其实是从特定的数据中挖掘模式,作出判断的过程。比如Gmail邮箱里有垃圾邮件分类器,一开始的时候可能什么都不过滤,在日常使用过程中,我人工对于每一封邮件点选“垃圾”或“不是垃圾”,过一段时间,Gmail就体现出一定的智能,能够自动过滤掉一些垃圾邮件了。
这是因为在点选的过程中,其实是给每一条邮件打了一个“标签”,这个标签只有两个值,要么是“垃圾”,要么“不是垃圾”,Gmail就会不断研究哪些特点的邮件是垃圾,哪些特点的不是垃圾,形成一些判别的模式,这样当一封信的邮件到来,就可以自动把邮件分到“垃圾”和“不是垃圾”这两个我们人工设定的分类的其中一个。
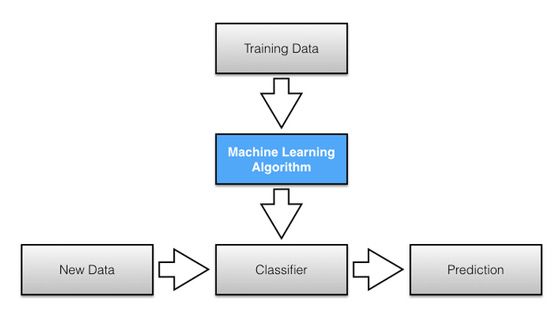
分类学习主要过程如下:
(1)训练数据集存在一个类标记号,判断它是正向数据集(起积极作用,不垃圾邮件),还是负向数据集(起抑制作用,垃圾邮件);
(2)然后需要对数据集进行学习训练,并构建一个训练的模型;
(3)通过该模型对预测数据集进预测,并计算其结果的性能。
2.决策树(decision tree)
决策树是用于分类和预测的主要技术之一,决策树学习是以实例为基础的归纳学习算法,它着眼于从一组无次序、无规则的实例中推理出以决策树表示的分类规则。构造决策树的目的是找出属性和类别间的关系,用它来预测将来未知类别的记录的类别。它采用自顶向下的递归方式,在决策树的内部节点进行属性的比较,并根据不同属性值判断从该节点向下的分支,在决策树的叶节点得到结论。
决策树算法根据数据的属性采用树状结构建立决策模型, 决策树模型常用来解决分类和回归问题。常见的算法包括:分类及回归树(Classification And Regression Tree, CART), ID3 (Iterative Dichotomiser 3), C4.5, Chi-squared Automatic Interaction Detection(CHAID), Decision Stump, 随机森林(Random Forest), 多元自适应回归样条(MARS)以及梯度推进机(Gradient Boosting Machine, GBM)。
决策数有两大优点:1)决策树模型可以读性好,具有描述性,有助于人工分析;2)效率高,决策树只需要一次构建,反复使用,每一次预测的最大计算次数不超过决策树的深度。
示例1:
下面举两个例子,参考下面文章,强烈推荐大家阅读,尤其是决策树原理。
算法杂货铺——分类算法之决策树(Decision tree) - leoo2sk
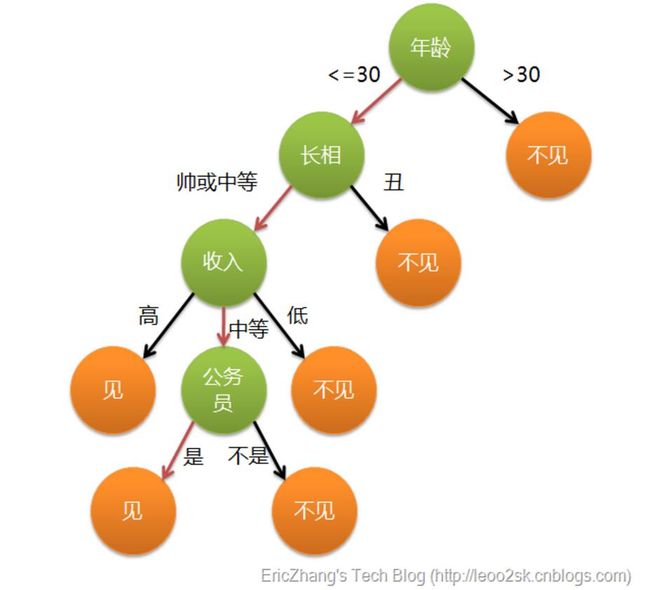
这个也是我上课讲述的例子,引用上面文章的。通俗来说,决策树分类的思想类似于找对象。现想象一个女孩的母亲要给这个女孩介绍男朋友,于是有了下面的对话:
女儿:多大年纪了?
母亲:26。
女儿:长的帅不帅?
母亲:挺帅的。
女儿:收入高不?
母亲:不算很高,中等情况。
女儿:是公务员不?
母亲:是,在税务局上班呢。
女儿:那好,我去见见。
这个女孩的决策过程就是典型的分类树决策。相当于通过年龄、长相、收入和是否公务员对将男人分为两个类别:见和不见。假设这个女孩对男人的要求是:30岁以下、长相中等以上并且是高收入者或中等以上收入的公务员,那么这个可以用下图表示女孩的决策逻辑。
示例2:
另一个课堂上的例子,参考CSDN的大神lsldd的文章,推荐大家阅读学习信息熵。
用Python开始机器学习(2:决策树分类算法)
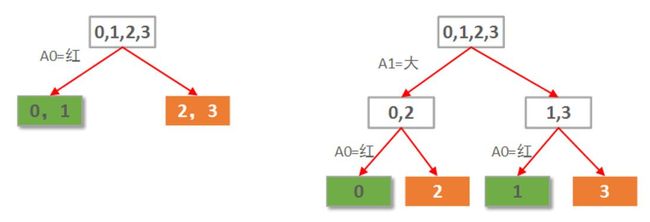
假设要构建这么一个自动选好苹果的决策树,简单起见,我只让他学习下面这4个样本:
样本    红     大      好苹果
0       1      1         1
1       1      0         1
2       0      1         0
3 0 0 0 本例仅2个属性。那么很自然一共就只可能有2棵决策树,如下图所示:
示例3:
第三个例子,推荐这篇文章:决策树学习笔记整理 - bourneli
决策树构建的基本步骤如下:
1. 开始,所有记录看作一个节点;
2. 遍历每个变量的每一种分割方式,找到最好的分割点;
3. 分割成两个节点N1和N2;
4. 对N1和N2分别继续执行2-3步,直到每个节点足够“纯”为止。
二. 鸢尾花卉Iris数据集
在Sklearn机器学习包中,集成了各种各样的数据集,上节课讲述Kmeans使用的是一个NBA篮球运动员数据集,需要定义X多维矩阵或读取文件导入,而这节课使用的是鸢尾花卉Iris数据集,它是很常用的一个数据集。
数据集来源:Iris plants data set - KEEL dataset
该数据集一共包含4个特征变量,1个类别变量。共有150个样本,鸢尾有三个亚属,分别是山鸢尾 (Iris-setosa),变色鸢尾(Iris-versicolor)和维吉尼亚鸢尾(Iris-virginica)。
iris是鸢尾植物,这里存储了其萼片和花瓣的长宽,共4个属性,鸢尾植物分三类。
iris里有两个属性iris.data,iris.target。
data里是一个矩阵,每一列代表了萼片或花瓣的长宽,一共4列,每一列代表某个被测量的鸢尾植物,一共采样了150条记录。代码如下:
#导入数据集iris
from sklearn.datasets import load_iris

#载入数据集
iris = load_iris()
#输出数据集
print iris.data[[ 5.1 3.5 1.4 0.2]
[ 4.9 3. 1.4 0.2]
[ 4.7 3.2 1.3 0.2]
[ 4.6 3.1 1.5 0.2]
[ 5. 3.6 1.4 0.2]
[ 5.4 3.9 1.7 0.4]
[ 4.6 3.4 1.4 0.3]
[ 5. 3.4 1.5 0.2]
[ 4.4 2.9 1.4 0.2]
....
[ 6.7 3. 5.2 2.3]
[ 6.3 2.5 5. 1.9]
[ 6.5 3. 5.2 2. ]
[ 6.2 3.4 5.4 2.3]
[ 5.9 3. 5.1 1.8]]Iris Setosa(山鸢尾)
Iris Versicolour(杂色鸢尾)
Iris Virginica(维吉尼亚鸢尾)
#输出真实标签
print iris.target
print len(iris.target)
#150个样本 每个样本4个特征
print iris.data.shape
[0 0 0 0 0 0 0 0 0 0 0 0 0 0 0 0 0 0 0 0 0 0 0 0 0 0 0 0 0 0 0 0 0 0 0 0 0
 0 0 0 0 0 0 0 0 0 0 0 0 0 1 1 1 1 1 1 1 1 1 1 1 1 1 1 1 1 1 1 1 1 1 1 1 1
 1 1 1 1 1 1 1 1 1 1 1 1 1 1 1 1 1 1 1 1 1 1 1 1 1 1 2 2 2 2 2 2 2 2 2 2 2
 2 2 2 2 2 2 2 2 2 2 2 2 2 2 2 2 2 2 2 2 2 2 2 2 2 2 2 2 2 2 2 2 2 2 2 2 2
 2 2]
150
(150L, 4L)
下面给详细介绍使用决策树进行对这个数据集进行测试的代码。
三. 决策树实现鸢尾数据集分析
1. DecisionTreeClassifier
Sklearn机器学习包中,决策树实现类是DecisionTreeClassifier,能够执行数据集的多类分类。
输入参数为两个数组X[n_samples,n_features]和y[n_samples],X为训练数据,y为训练数据的标记数据。
DecisionTreeClassifier构造方法为:
sklearn.tree.DecisionTreeClassifier(criterion='gini'
				      , splitter='best'
				      , max_depth=None
				      , min_samples_split=2
				      , min_samples_leaf=1
				      , max_features=None
				      , random_state=None
				      , min_density=None
				      , compute_importances=None
, max_leaf_nodes=None)# -*- coding: utf-8 -*-
"""
Created on Fri Oct 14 21:44:19 2016
@author: 杨秀璋
"""
#导入数据集iris
from sklearn.datasets import load_iris
#载入数据集
iris = load_iris()
print iris.data #输出数据集
print iris.target #输出真实标签
print len(iris.target)
print iris.data.shape #150个样本 每个样本4个特征
#导入决策树DTC包
from sklearn.tree import DecisionTreeClassifier
#训练
clf = DecisionTreeClassifier()
clf.fit(iris.data, iris.target)
print clf
#预测
predicted = clf.predict(iris.data)
#获取花卉两列数据集
X = iris.data
L1 = [x[0] for x in X]
print L1
L2 = [x[1] for x in X]
print L2
#绘图
import numpy as np
import matplotlib.pyplot as plt
plt.scatter(L1, L2, c=predicted, marker='x') #cmap=plt.cm.Paired
plt.title("DTC")
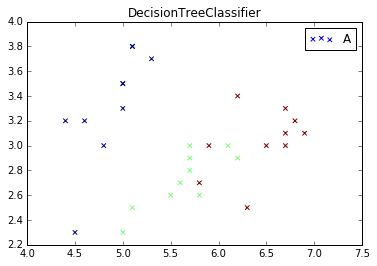
plt.show()输出结果如下所示,可以看到分位三类,分别代表数据集三种鸢尾植物。
2.代码优化
在课堂上我讲过,这里存在两个问题:
1.前面鸢尾Iris数据集包括四个特征(萼片长度、萼片宽度、花瓣长度、花瓣宽度),上面代码中"L1 = [x[0] for x in X]"我获取了第一列和第二列数据集进行的绘图,而真是数据集中可能存在多维特征,那怎么实现呢?
这里涉及到一个降维操作,后面会详细介绍。
2.第二个问题是,分类学习模型如下所示,它的预测是通过一组新的数据集。
而上面的代码"predicted = clf.predict(iris.data)"是对整个的数据集进行决策树分析,而真是的分类分析,需要把一部分数据集作为训练,一部分作为预测,这里使用70%的训练,30%的进行预测。代码如下:
#训练集
train_data = np.concatenate((iris.data[0:40, :], iris.data[50:90, :], iris.data[100:140, :]), axis = 0)
#训练集样本类别
train_target = np.concatenate((iris.target[0:40], iris.target[50:90], iris.target[100:140]), axis = 0)
#测试集
test_data = np.concatenate((iris.data[40:50, :], iris.data[90:100, :], iris.data[140:150, :]), axis = 0)
#测试集样本类别
test_target = np.concatenate((iris.target[40:50], iris.target[90:100], iris.target[140:150]), axis = 0)# -*- coding: utf-8 -*-
"""
Created on Fri Oct 14 21:44:19 2016
@author: 杨秀璋
"""
#导入数据集iris
from sklearn.datasets import load_iris
#载入数据集
iris = load_iris()
'''
print iris.data #输出数据集
print iris.target #输出真实标签
print len(iris.target)
print iris.data.shape #150个样本 每个样本4个特征
'''
'''
重点:分割数据集 构造训练集/测试集,120/30
70%训练 0-40 50-90 100-140
30%预测 40-50 90-100 140-150
'''
#训练集
train_data = np.concatenate((iris.data[0:40, :], iris.data[50:90, :], iris.data[100:140, :]), axis = 0)
#训练集样本类别
train_target = np.concatenate((iris.target[0:40], iris.target[50:90], iris.target[100:140]), axis = 0)
#测试集
test_data = np.concatenate((iris.data[40:50, :], iris.data[90:100, :], iris.data[140:150, :]), axis = 0)
#测试集样本类别
test_target = np.concatenate((iris.target[40:50], iris.target[90:100], iris.target[140:150]), axis = 0)
#导入决策树DTC包
from sklearn.tree import DecisionTreeClassifier
#训练
clf = DecisionTreeClassifier()
#注意均使用训练数据集和样本类标
clf.fit(train_data, train_target)
print clf
#预测结果
predict_target = clf.predict(test_data)
print predict_target
#预测结果与真实结果比对
print sum(predict_target == test_target)
#输出准确率 召回率 F值
from sklearn import metrics
print(metrics.classification_report(test_target, predict_target))
print(metrics.confusion_matrix(test_target, predict_target))
#获取花卉测试数据集两列数据集
X = test_data
L1 = [n[0] for n in X]
print L1
L2 = [n[1] for n in X]
print L2
#绘图
import numpy as np
import matplotlib.pyplot as plt
plt.scatter(L1, L2, c=predict_target, marker='x') #cmap=plt.cm.Paired
plt.title("DecisionTreeClassifier")
plt.show()
DecisionTreeClassifier(class_weight=None, criterion='gini', max_depth=None,
            max_features=None, max_leaf_nodes=None, min_samples_leaf=1,
            min_samples_split=2, min_weight_fraction_leaf=0.0,
            presort=False, random_state=None, splitter='best')
[0 0 0 0 0 0 0 0 0 0 1 1 1 1 1 1 1 1 1 1 2 2 2 2 2 2 2 2 2 2]
30
             precision    recall  f1-score   support

          0       1.00      1.00      1.00        10
          1       1.00      1.00      1.00        10
          2       1.00      1.00      1.00        10

avg / total       1.00      1.00      1.00        30

[[10  0  0]
 [ 0 10  0]
 [ 0  0 10]]
3.补充知识
最后补充Skleaern官网上的一个决策树的例子,推荐大家学习。
推荐地址:Plot the decision surface of a decision tree on the iris dataset
代码如下:
# -*- coding: utf-8 -*-
"""
Created on Wed Oct 12 23:30:34 2016

@author: yxz15
"""

print(__doc__)

import numpy as np
import matplotlib.pyplot as plt

from sklearn.datasets import load_iris
from sklearn.tree import DecisionTreeClassifier

# Parameters
n_classes = 3
plot_colors = "bry"
plot_step = 0.02

# Load data
iris = load_iris()

for pairidx, pair in enumerate([[0, 1], [0, 2], [0, 3],
                                [1, 2], [1, 3], [2, 3]]):
    # We only take the two corresponding features
    X = iris.data[:, pair]
    y = iris.target

    # Train
    clf = DecisionTreeClassifier().fit(X, y)

    # Plot the decision boundary
    plt.subplot(2, 3, pairidx + 1)

    x_min, x_max = X[:, 0].min() - 1, X[:, 0].max() + 1
    y_min, y_max = X[:, 1].min() - 1, X[:, 1].max() + 1
    xx, yy = np.meshgrid(np.arange(x_min, x_max, plot_step),
                         np.arange(y_min, y_max, plot_step))

    Z = clf.predict(np.c_[xx.ravel(), yy.ravel()])
    Z = Z.reshape(xx.shape)
    cs = plt.contourf(xx, yy, Z, cmap=plt.cm.Paired)

    plt.xlabel(iris.feature_names[pair[0]])
    plt.ylabel(iris.feature_names[pair[1]])
    plt.axis("tight")

    # Plot the training points
    for i, color in zip(range(n_classes), plot_colors):
        idx = np.where(y == i)
        plt.scatter(X[idx, 0], X[idx, 1], c=color, label=iris.target_names[i],
                    cmap=plt.cm.Paired)

    plt.axis("tight")

plt.suptitle("Decision surface of a decision tree using paired features")
plt.legend()
plt.show()绘制可视化决策树图部分,总是报错:
AttributeError: 'NoneType' object has no attribute 'write'
'''
生成可视化训练好的决策树
详见:http://scikit-learn.org/stable/modules/tree.html
'''
from sklearn.externals.six import StringIO
from sklearn.tree import export_graphviz
with open("iris.dot", 'w') as f:
    f = export_graphviz(clf, out_file=f)

import pydotplus
from sklearn import tree
dot_data = tree.export_graphviz(clf, out_file=None)
graph = pydotplus.graph_from_dot_data(dot_data)
graph.write_pdf("iris.pdf")

from IPython.display import Image
from sklearn import tree
import pydotplus
dot_data = tree.export_graphviz(clf, out_file="tree.dot",
                         feature_names=iris.feature_names,
                         class_names=iris.target_names,
                         filled=True, rounded=True,
                         special_characters=True)
graph = pydotplus.graph_from_dot_data(dot_data)
Image(graph.create_png())
其中iris.dot数据如下所示:
digraph Tree {
node [shape=box] ;
0 [label="X[2] <= 2.6\ngini = 0.6667\nsamples = 120\nvalue = [40, 40, 40]"] ;
1 [label="gini = 0.0\nsamples = 40\nvalue = [40, 0, 0]"] ;
0 -> 1 [labeldistance=2.5, labelangle=45, headlabel="True"] ;
2 [label="X[3] <= 1.75\ngini = 0.5\nsamples = 80\nvalue = [0, 40, 40]"] ;
0 -> 2 [labeldistance=2.5, labelangle=-45, headlabel="False"] ;
3 [label="X[2] <= 4.95\ngini = 0.2014\nsamples = 44\nvalue = [0, 39, 5]"] ;
2 -> 3 ;
4 [label="X[3] <= 1.65\ngini = 0.0512\nsamples = 38\nvalue = [0, 37, 1]"] ;
3 -> 4 ;
5 [label="gini = 0.0\nsamples = 37\nvalue = [0, 37, 0]"] ;
4 -> 5 ;
6 [label="gini = 0.0\nsamples = 1\nvalue = [0, 0, 1]"] ;
4 -> 6 ;
7 [label="X[3] <= 1.55\ngini = 0.4444\nsamples = 6\nvalue = [0, 2, 4]"] ;
3 -> 7 ;
8 [label="gini = 0.0\nsamples = 3\nvalue = [0, 0, 3]"] ;
7 -> 8 ;
9 [label="X[0] <= 6.95\ngini = 0.4444\nsamples = 3\nvalue = [0, 2, 1]"] ;
7 -> 9 ;
10 [label="gini = 0.0\nsamples = 2\nvalue = [0, 2, 0]"] ;
9 -> 10 ;
11 [label="gini = 0.0\nsamples = 1\nvalue = [0, 0, 1]"] ;
9 -> 11 ;
12 [label="X[2] <= 4.85\ngini = 0.054\nsamples = 36\nvalue = [0, 1, 35]"] ;
2 -> 12 ;
13 [label="X[1] <= 3.1\ngini = 0.4444\nsamples = 3\nvalue = [0, 1, 2]"] ;
12 -> 13 ;
14 [label="gini = 0.0\nsamples = 2\nvalue = [0, 0, 2]"] ;
13 -> 14 ;
15 [label="gini = 0.0\nsamples = 1\nvalue = [0, 1, 0]"] ;
13 -> 15 ;
16 [label="gini = 0.0\nsamples = 33\nvalue = [0, 0, 33]"] ;
12 -> 16 ;
}
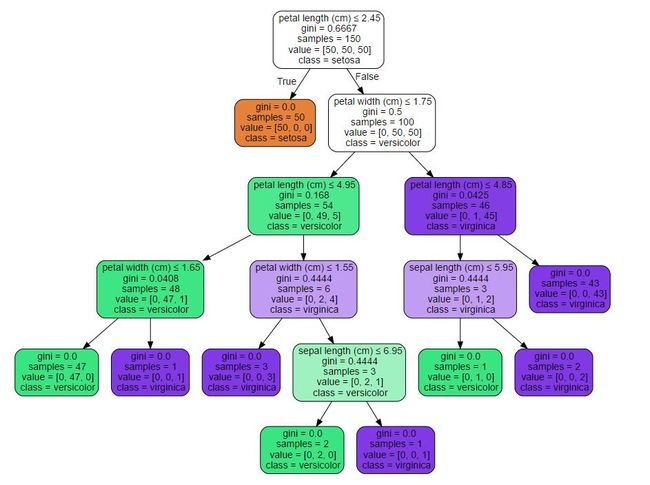
想生成如下图,希望后面能修改。也可以进入shell下输入命令:
$ sudo apt-get install graphviz
$ dot -Tpng iris.dot -o tree.png  # 生成png图片
$ dot -Tpdf iris.dot -o tree.pdf  # 生成pdf
最后文章对你有所帮助,上课内容还需要继续探索,但enjoy myself~
(By:Eastmount 2016-10-15 中午1点半 http://blog.csdn.net/eastmount/ )

