import matplotlib;
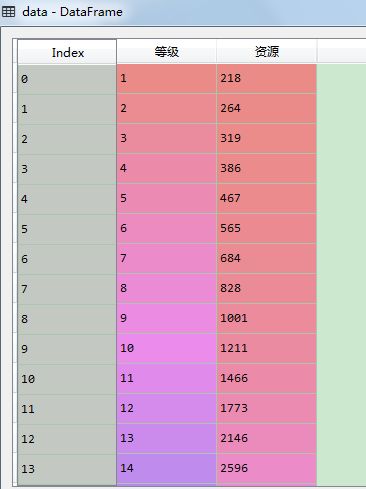
data = pandas.read_csv(
'D:/PDM/4.3/data.csv'
)
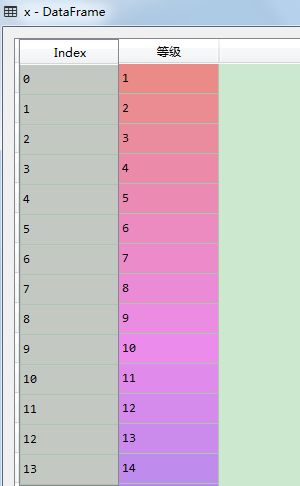
x = data[["等级"]]
y = data[["资源"]]
font = {
'family' : 'SimHei'
};
matplotlib.rc('font', **font);
matplotlib.rcParams['axes.unicode_minus'] = False
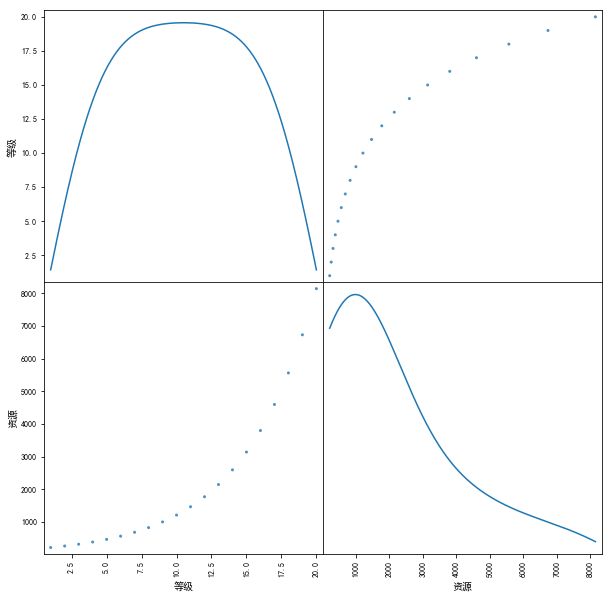
from pandas.tools.plotting import scatter_matrix;
scatter_matrix(
data[["等级", "资源"]],
alpha=0.8, figsize=(10, 10), diagonal='kde'
)
import numpy;
x_ = numpy.arange(-10, 10, 0.01);
y_ = x_**2
from matplotlib import pyplot as plt;
plt.figure();
plt.title('等级与资源')
plt.xlabel('等级')
plt.ylabel('资源')
plt.grid(True)
plt.plot(x_, y_, 'k.')
plt.show()
from sklearn.linear_model import LinearRegression
from sklearn.preprocessing import PolynomialFeatures
x
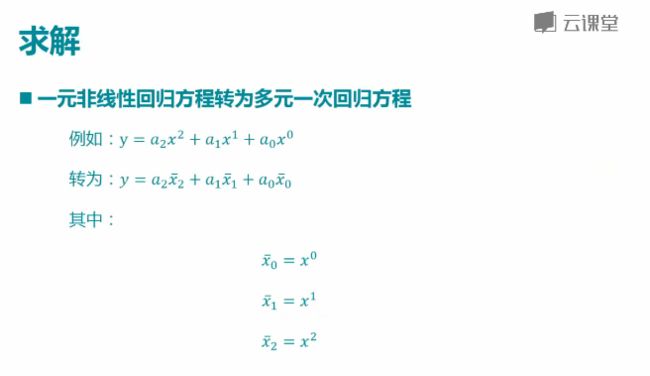
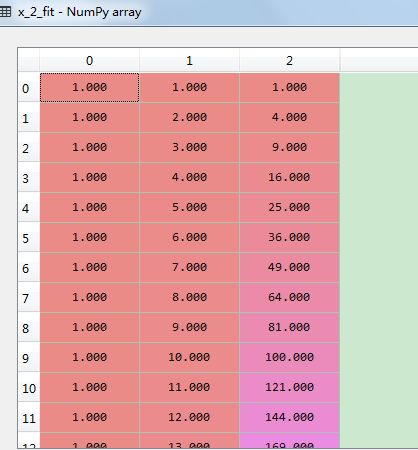
pf = PolynomialFeatures(degree=2)
x_2_fit = pf.fit_transform(x)
x_2_fit
lrModel = LinearRegression()
lrModel.fit(x_2_fit, y)
lrModel.score(x_2_fit, y)
0.98438623929845115
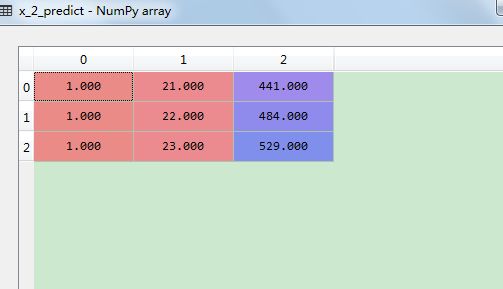
x_2_predict = pf.fit_transform([[21], [22], [23]])#预测数值,21,22,23是输入值,但是需要转换以后才能进行预测。
lrModel.predict(x_2_predict)
