image:
repository: k8s.harbor.maimaiti.site/system/fluentd
## Specify an imagePullPolicy (Required)
## It's recommended to change this to 'Always' if the image tag is 'latest'
## ref: http://kubernetes.io/docs/user-guide/images/#updating-images
tag: v2.5.1
pullPolicy: IfNotPresent
## Optionally specify an array of imagePullSecrets.
## Secrets must be manually created in the namespace.
## ref: https://kubernetes.io/docs/tasks/configure-pod-container/pull-image-private-registry/
##
# pullSecrets:
# - myRegistrKeySecretName
## If using AWS Elasticsearch, all requests to ES need to be signed regardless of whether
## one is using Cognito or not. By setting this to true, this chart will install a sidecar
## proxy that takes care of signing all requests being sent to the AWS ES Domain.
awsSigningSidecar:
enabled: false
image:
repository: abutaha/aws-es-proxy
tag: 0.9
# Specify to use specific priorityClass for pods
# ref: https://kubernetes.io/docs/concepts/configuration/pod-priority-preemption/
# If a Pod cannot be scheduled, the scheduler tries to preempt (evict) lower priority
# Pods to make scheduling of the pending Pod possible.
priorityClassName: ""
## Configure resource requests and limits
## ref: http://kubernetes.io/docs/user-guide/compute-resources/
##
resources: {}
# limits:
# cpu: 100m
# memory: 500Mi
# requests:
# cpu: 100m
# memory: 200Mi
elasticsearch:
host: 'elasticsearch-client.kube-system'
port: 9200
scheme: 'http'
ssl_version: TLSv1_2
user: ""
password: ""
buffer_chunk_limit: 2M
buffer_queue_limit: 8
logstash_prefix: 'logstash'
# If you want to add custom environment variables, use the env dict
# You can then reference these in your config file e.g.:
# user "#{ENV['OUTPUT_USER']}"
env:
# OUTPUT_USER: my_user
# LIVENESS_THRESHOLD_SECONDS: 300
# STUCK_THRESHOLD_SECONDS: 900
# If you want to add custom environment variables from secrets, use the secret list
secret:
# - name: ELASTICSEARCH_PASSWORD
# secret_name: elasticsearch
# secret_key: password
rbac:
create: true
serviceAccount:
# Specifies whether a ServiceAccount should be created
create: true
# The name of the ServiceAccount to use.
# If not set and create is true, a name is generated using the fullname template
name: ""
## Specify if a Pod Security Policy for node-exporter must be created
## Ref: https://kubernetes.io/docs/concepts/policy/pod-security-policy/
##
podSecurityPolicy:
enabled: false
annotations: {}
## Specify pod annotations
## Ref: https://kubernetes.io/docs/concepts/policy/pod-security-policy/#apparmor
## Ref: https://kubernetes.io/docs/concepts/policy/pod-security-policy/#seccomp
## Ref: https://kubernetes.io/docs/concepts/policy/pod-security-policy/#sysctl
##
# seccomp.security.alpha.kubernetes.io/allowedProfileNames: '*'
# seccomp.security.alpha.kubernetes.io/defaultProfileName: 'docker/default'
# apparmor.security.beta.kubernetes.io/defaultProfileName: 'runtime/default'
livenessProbe:
enabled: true
annotations: {}
podAnnotations:
prometheus.io/scrape: "true"
prometheus.io/port: "24231"
## DaemonSet update strategy
## Ref: https://kubernetes.io/docs/tasks/manage-daemon/update-daemon-set/
updateStrategy:
type: RollingUpdate
tolerations:
- key: node-role.kubernetes.io/master
operator: Exists
effect: NoSchedule
affinity: {}
# nodeAffinity:
# requiredDuringSchedulingIgnoredDuringExecution:
# nodeSelectorTerms:
# - matchExpressions:
# - key: node-role.kubernetes.io/master
# operator: DoesNotExist
nodeSelector: {}
service:
type: ClusterIP
ports:
- name: "monitor-agent"
port: 24231
serviceMonitor:
## If true, a ServiceMonitor CRD is created for a prometheus operator
## https://github.com/coreos/prometheus-operator
##
enabled: false
interval: 10s
path: /metrics
labels: {}
prometheusRule:
## If true, a PrometheusRule CRD is created for a prometheus operator
## https://github.com/coreos/prometheus-operator
##
enabled: false
prometheusNamespace: monitoring
labels: {}
# role: alert-rules
configMaps:
system.conf: |-
root_dir /tmp/fluentd-buffers/
containers.input.conf: |-
# This configuration file for Fluentd / td-agent is used
# to watch changes to Docker log files. The kubelet creates symlinks that
# capture the pod name, namespace, container name & Docker container ID
# to the docker logs for pods in the /var/log/containers directory on the host.
# If running this fluentd configuration in a Docker container, the /var/log
# directory should be mounted in the container.
#
# These logs are then submitted to Elasticsearch which assumes the
# installation of the fluent-plugin-elasticsearch & the
# fluent-plugin-kubernetes_metadata_filter plugins.
# See https://github.com/uken/fluent-plugin-elasticsearch &
# https://github.com/fabric8io/fluent-plugin-kubernetes_metadata_filter for
# more information about the plugins.
#
# Example
# =======
# A line in the Docker log file might look like this JSON:
#
# {"log":"2014/09/25 21:15:03 Got request with path wombat\n",
# "stream":"stderr",
# "time":"2014-09-25T21:15:03.499185026Z"}
#
# The time_format specification below makes sure we properly
# parse the time format produced by Docker. This will be
# submitted to Elasticsearch and should appear like:
# $ curl 'http://elasticsearch-logging:9200/_search?pretty'
# ...
# {
# "_index" : "logstash-2014.09.25",
# "_type" : "fluentd",
# "_id" : "VBrbor2QTuGpsQyTCdfzqA",
# "_score" : 1.0,
# "_source":{"log":"2014/09/25 22:45:50 Got request with path wombat\n",
# "stream":"stderr","tag":"docker.container.all",
# "@timestamp":"2014-09-25T22:45:50+00:00"}
# },
# ...
#
# The Kubernetes fluentd plugin is used to write the Kubernetes metadata to the log
# record & add labels to the log record if properly configured. This enables users
# to filter & search logs on any metadata.
# For example a Docker container's logs might be in the directory:
#
# /var/lib/docker/containers/997599971ee6366d4a5920d25b79286ad45ff37a74494f262e3bc98d909d0a7b
#
# and in the file:
#
# 997599971ee6366d4a5920d25b79286ad45ff37a74494f262e3bc98d909d0a7b-json.log
#
# where 997599971ee6... is the Docker ID of the running container.
# The Kubernetes kubelet makes a symbolic link to this file on the host machine
# in the /var/log/containers directory which includes the pod name and the Kubernetes
# container name:
#
# synthetic-logger-0.25lps-pod_default_synth-lgr-997599971ee6366d4a5920d25b79286ad45ff37a74494f262e3bc98d909d0a7b.log
# ->
# /var/lib/docker/containers/997599971ee6366d4a5920d25b79286ad45ff37a74494f262e3bc98d909d0a7b/997599971ee6366d4a5920d25b79286ad45ff37a74494f262e3bc98d909d0a7b-json.log
#
# The /var/log directory on the host is mapped to the /var/log directory in the container
# running this instance of Fluentd and we end up collecting the file:
#
# /var/log/containers/synthetic-logger-0.25lps-pod_default_synth-lgr-997599971ee6366d4a5920d25b79286ad45ff37a74494f262e3bc98d909d0a7b.log
#
# This results in the tag:
#
# var.log.containers.synthetic-logger-0.25lps-pod_default_synth-lgr-997599971ee6366d4a5920d25b79286ad45ff37a74494f262e3bc98d909d0a7b.log
#
# The Kubernetes fluentd plugin is used to extract the namespace, pod name & container name
# which are added to the log message as a kubernetes field object & the Docker container ID
# is also added under the docker field object.
# The final tag is:
#
# kubernetes.var.log.containers.synthetic-logger-0.25lps-pod_default_synth-lgr-997599971ee6366d4a5920d25b79286ad45ff37a74494f262e3bc98d909d0a7b.log
#
# And the final log record look like:
#
# {
# "log":"2014/09/25 21:15:03 Got request with path wombat\n",
# "stream":"stderr",
# "time":"2014-09-25T21:15:03.499185026Z",
# "kubernetes": {
# "namespace": "default",
# "pod_name": "synthetic-logger-0.25lps-pod",
# "container_name": "synth-lgr"
# },
# "docker": {
# "container_id": "997599971ee6366d4a5920d25b79286ad45ff37a74494f262e3bc98d909d0a7b"
# }
# }
#
# This makes it easier for users to search for logs by pod name or by
# the name of the Kubernetes container regardless of how many times the
# Kubernetes pod has been restarted (resulting in a several Docker container IDs).
# Json Log Example:
# {"log":"[info:2016-02-16T16:04:05.930-08:00] Some log text here\n","stream":"stdout","time":"2016-02-17T00:04:05.931087621Z"}
# CRI Log Example:
# 2016-02-17T00:04:05.931087621Z stdout F [info:2016-02-16T16:04:05.930-08:00] Some log text here
@id fluentd-containers.log
@type tail
path /var/log/containers/*.log
pos_file /var/log/containers.log.pos
tag raw.kubernetes.*
read_from_head true
@type multi_format
format json
time_key time
time_format %Y-%m-%dT%H:%M:%S.%NZ
format /^(?
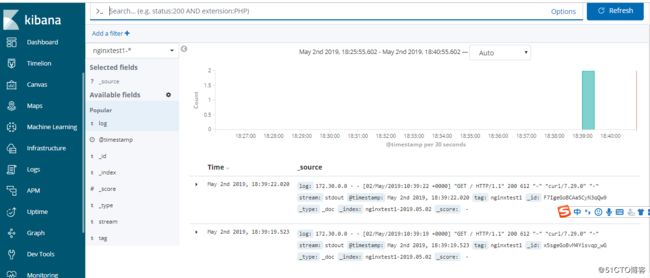
@id nginxtest1.log
@type tail
path /var/log/containers/nginxtest1-*.log
pos_file /var/log/nginxtest1.log.pos
tag nginxtest1
read_from_head true
@type multi_format
format json
time_key time
time_format %Y-%m-%dT%H:%M:%S.%NZ
format /^(?
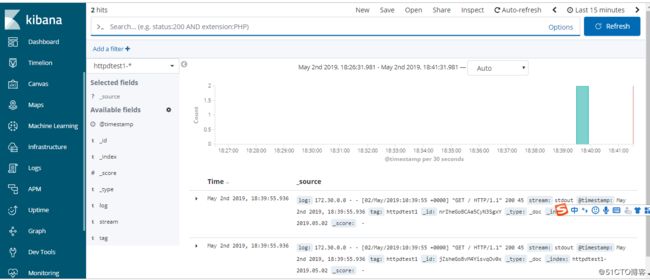
@id httpdtest1.log
@type tail
path /var/log/containers/httpdtest1-*.log
pos_file /var/log/httpdtest1.log.pos
tag httpdtest1
read_from_head true
@type multi_format
format json
time_key time
time_format %Y-%m-%dT%H:%M:%S.%NZ
format /^(?
# Detect exceptions in the log output and forward them as one log entry.
@id raw.kubernetes
@type detect_exceptions
remove_tag_prefix raw
message log
stream stream
multiline_flush_interval 5
max_bytes 500000
max_lines 1000
# Concatenate multi-line logs
@id filter_concat
@type concat
key message
multiline_end_regexp /\n$/
separator ""
# Enriches records with Kubernetes metadata
@id filter_kubernetes_metadata
@type kubernetes_metadata
# Fixes json fields in Elasticsearch
@id filter_parser
@type parser
key_name log
reserve_data true
remove_key_name_field true
@type multi_format
format json
format none
system.input.conf: |-
# Example:
# 2015-12-21 23:17:22,066 [salt.state ][INFO ] Completed state [net.ipv4.ip_forward] at time 23:17:22.066081
@id minion
@type tail
format /^(?
# Example:
# Dec 21 23:17:22 gke-foo-1-1-4b5cbd14-node-4eoj startupscript: Finished running startup script /var/run/google.startup.script
@id startupscript.log
@type tail
format syslog
path /var/log/startupscript.log
pos_file /var/log/startupscript.log.pos
tag startupscript
# Examples:
# time="2016-02-04T06:51:03.053580605Z" level=info msg="GET /containers/json"
# time="2016-02-04T07:53:57.505612354Z" level=error msg="HTTP Error" err="No such image: -f" statusCode=404
# TODO(random-liu): Remove this after cri container runtime rolls out.
@id docker.log
@type tail
format /^time="(?
# Example:
# 2016/02/04 06:52:38 filePurge: successfully removed file /var/etcd/data/member/wal/00000000000006d0-00000000010a23d1.wal
@id etcd.log
@type tail
# Not parsing this, because it doesn't have anything particularly useful to
# parse out of it (like severities).
format none
path /var/log/etcd.log
pos_file /var/log/etcd.log.pos
tag etcd
# Multi-line parsing is required for all the kube logs because very large log
# statements, such as those that include entire object bodies, get split into
# multiple lines by glog.
# Example:
# I0204 07:32:30.020537 3368 server.go:1048] POST /stats/container/: (13.972191ms) 200 [[Go-http-client/1.1] 10.244.1.3:40537]
@id kubelet.log
@type tail
format multiline
multiline_flush_interval 5s
format_firstline /^\w\d{4}/
format1 /^(?\w)(?
LAST DEPLOYED: Tue Apr 30 17:55:30 2019
NAMESPACE: kube-system
STATUS: DEPLOYED

RESOURCES:
==> v1/ConfigMap
NAME                   DATA  AGE
fluentd-elasticsearch  6     2d

==> v1/ServiceAccount
NAME                   SECRETS  AGE
fluentd-elasticsearch  1        2d

==> v1/ClusterRole
NAME                   AGE
fluentd-elasticsearch  2d

==> v1/ClusterRoleBinding
NAME                   AGE
fluentd-elasticsearch  2d

==> v1/Service
NAME                   TYPE       CLUSTER-IP     EXTERNAL-IP  PORT(S)    AGE
fluentd-elasticsearch  ClusterIP  10.200.108.50         24231/TCP  2d

==> v1/DaemonSet
NAME                   DESIRED  CURRENT  READY  UP-TO-DATE  AVAILABLE  NODE SELECTOR  AGE
fluentd-elasticsearch  8        8        8      8           8                   2d

==> v1/Pod(related)
NAME                         READY  STATUS   RESTARTS  AGE
fluentd-elasticsearch-2trp8  1/1    RunningE0502 18:09:33.641998   29738 portforward.go:303] error copying from remote stream to local connection: readfrom tcp4 127.0.0.1:39598->127.0.0.1:43154: write tcp4 127.0.0.1:39598->127.0.0.1:43154: write: broken pipe
  0         2d
fluentd-elasticsearch-2xgtb  1/1    Running  0         2d
fluentd-elasticsearch-589jc  1/1    Running  0         2d
fluentd-elasticsearch-ctkv8  1/1    Running  0         2d
fluentd-elasticsearch-d5dvz  1/1    Running  0         2d
fluentd-elasticsearch-kgdxp  1/1    Running  0         2d
fluentd-elasticsearch-r2c8h  1/1    Running  0         2d
fluentd-elasticsearch-z8p7b  1/1    Running  0         2d

NOTES:
1. To verify that Fluentd has started, run:

  kubectl --namespace=kube-system get pods -l "app.kubernetes.io/name=fluentd-elasticsearch,app.kubernetes.io/instance=fluentd-elasticsearch"

THIS APPLICATION CAPTURES ALL CONSOLE OUTPUT AND FORWARDS IT TO elasticsearch . Anything that might be identifying,
including things like IP addresses, container images, and object names will NOT be anonymized.
2. Get the application URL by running these commands:
  export POD_NAME=$(kubectl get pods --namespace kube-system -l "app.kubernetes.io/name=fluentd-elasticsearch,app.kubernetes.io/instance=fluentd-elasticsearch" -o jsonpath="{.items[0].metadata.name}")
  echo "Visit http://127.0.0.1:8080 to use your application"
  kubectl port-forward $POD_NAME 8080:80
下面的ES集群的value.yaml配置
# Default values for elasticsearch.
# This is a YAML-formatted file.
# Declare variables to be passed into your templates.
appVersion: "6.7.0"

## Define serviceAccount names for components. Defaults to component's fully qualified name.
##
serviceAccounts:
  client:
    create: true
    name:
  master:
    create: true
    name:
  data:
    create: true
    name:

## Specify if a Pod Security Policy for node-exporter must be created
## Ref: https://kubernetes.io/docs/concepts/policy/pod-security-policy/
##
podSecurityPolicy:
  enabled: false
  annotations: {}
    ## Specify pod annotations
    ## Ref: https://kubernetes.io/docs/concepts/policy/pod-security-policy/#apparmor
    ## Ref: https://kubernetes.io/docs/concepts/policy/pod-security-policy/#seccomp
    ## Ref: https://kubernetes.io/docs/concepts/policy/pod-security-policy/#sysctl
    ##
    # seccomp.security.alpha.kubernetes.io/allowedProfileNames: '*'
    # seccomp.security.alpha.kubernetes.io/defaultProfileName: 'docker/default'
    # apparmor.security.beta.kubernetes.io/defaultProfileName: 'runtime/default'

image:
  # repository: "k8s.harbor.maimaiti.site/system/elasticsearch-oss"
  repository: "k8s.harbor.maimaiti.site/system/elasticsearch"
  tag: "6.7.0"
  pullPolicy: "IfNotPresent"
  # If specified, use these secrets to access the image
  # pullSecrets:
  #   - registry-secret

testFramework:
  image: "dduportal/bats"
  tag: "0.4.0"

initImage:
  repository: "busybox"
  tag: "latest"
  pullPolicy: "Always"

cluster:
  name: "elasticsearch"
  # If you want X-Pack installed, switch to an image that includes it, enable this option and toggle the features you want
  # enabled in the environment variables outlined in the README
  xpackEnable: true
  # Some settings must be placed in a keystore, so they need to be mounted in from a secret.
  # Use this setting to specify the name of the secret
  # keystoreSecret: eskeystore
  config: {}
  # Custom parameters, as string, to be added to ES_JAVA_OPTS environment variable
  additionalJavaOpts: ""
  # Command to run at the end of deployment
  bootstrapShellCommand: ""
  env:
    # IMPORTANT: https://www.elastic.co/guide/en/elasticsearch/reference/current/important-settings.html#minimum_master_nodes
    # To prevent data loss, it is vital to configure the discovery.zen.minimum_master_nodes setting so that each master-eligible
    # node knows the minimum number of master-eligible nodes that must be visible in order to form a cluster.
    MINIMUM_MASTER_NODES: "2"
  # List of plugins to install via dedicated init container
  plugins: []
    # - ingest-attachment
    # - mapper-size

client:
  name: client
  replicas: 2
  serviceType: ClusterIP
  ## If coupled with serviceType = "NodePort", this will set a specific nodePort to the client HTTP port
  # httpNodePort: 30920
  loadBalancerIP: {}
  loadBalancerSourceRanges: {}
## (dict) If specified, apply these annotations to the client service
#  serviceAnnotations:
#    example: client-svc-foo
  heapSize: "512m"
  # additionalJavaOpts: "-XX:MaxRAM=512m"
  antiAffinity: "soft"
  nodeAffinity: {}
  nodeSelector: {}
  tolerations: []
  initResources: {}
    # limits:
    #   cpu: "25m"
    #   # memory: "128Mi"
    # requests:
    #   cpu: "25m"
    #   memory: "128Mi"
  resources:
    limits:
      cpu: "1"
      # memory: "1024Mi"
    requests:
      cpu: "25m"
      memory: "512Mi"
  priorityClassName: ""
  ## (dict) If specified, apply these annotations to each client Pod
  # podAnnotations:
  #   example: client-foo
  podDisruptionBudget:
    enabled: false
    minAvailable: 1
    # maxUnavailable: 1
  ingress:
    enabled: false
    # user: NAME
    # password: PASSWORD
    annotations: {}
      # kubernetes.io/ingress.class: nginx
      # kubernetes.io/tls-acme: "true"
    path: /
    hosts:
      - chart-example.local
    tls: []
    #  - secretName: chart-example-tls
    #    hosts:
    #      - chart-example.local

master:
  name: master
  exposeHttp: false
  replicas: 3
  heapSize: "512m"
  # additionalJavaOpts: "-XX:MaxRAM=512m"
  persistence:
    enabled: false
    accessMode: ReadWriteOnce
    name: data
    size: "4Gi"
    storageClass: "dynamic"
  readinessProbe:
    httpGet:
      path: /_cluster/health?local=true
      port: 9200
    initialDelaySeconds: 5
  antiAffinity: "soft"
  nodeAffinity: {}
  nodeSelector: {}
  tolerations: []
  initResources: {}
    # limits:
    #   cpu: "25m"
    #   # memory: "128Mi"
    # requests:
    #   cpu: "25m"
    #   memory: "128Mi"
  resources:
    limits:
      cpu: "1"
      # memory: "1024Mi"
    requests:
      cpu: "25m"
      memory: "512Mi"
  priorityClassName: ""
  ## (dict) If specified, apply these annotations to each master Pod
  # podAnnotations:
  #   example: master-foo
  podManagementPolicy: OrderedReady
  podDisruptionBudget:
    enabled: false
    minAvailable: 2  # Same as `cluster.env.MINIMUM_MASTER_NODES`
    # maxUnavailable: 1
  updateStrategy:
    type: OnDelete

data:
  name: data
  exposeHttp: false
  replicas: 2
  heapSize: "1536m"
  # additionalJavaOpts: "-XX:MaxRAM=1536m"
  persistence:
    enabled: false
    accessMode: ReadWriteOnce
    name: data
    size: "30Gi"
    storageClass: "dynamic"
  readinessProbe:
    httpGet:
      path: /_cluster/health?local=true
      port: 9200
    initialDelaySeconds: 5
  terminationGracePeriodSeconds: 3600
  antiAffinity: "soft"
  nodeAffinity: {}
  nodeSelector: {}
  tolerations: []
  initResources: {}
    # limits:
    #   cpu: "25m"
    #   # memory: "128Mi"
    # requests:
    #   cpu: "25m"
    #   memory: "128Mi"
  resources:
    limits:
      cpu: "1"
      # memory: "2048Mi"
    requests:
      cpu: "25m"
      memory: "1536Mi"
  priorityClassName: ""
  ## (dict) If specified, apply these annotations to each data Pod
  # podAnnotations:
  #   example: data-foo
  podDisruptionBudget:
    enabled: false
    # minAvailable: 1
    maxUnavailable: 1
  podManagementPolicy: OrderedReady
  updateStrategy:
    type: OnDelete
  hooks:  # post-start and pre-stop hooks
    drain:  # drain the node before stopping it and re-integrate it into the cluster after start
      enabled: true

## Sysctl init container to setup vm.max_map_count
# see https://www.elastic.co/guide/en/elasticsearch/reference/current/vm-max-map-count.html
# and https://www.elastic.co/guide/en/elasticsearch/reference/current/setup-configuration-memory.html#mlockall
sysctlInitContainer:
  enabled: true
## Additional init containers
extraInitContainers: |
[root@master-01 fluentd-elasticsearch]# helm status elasticsearch
LAST DEPLOYED: Tue Apr 30 17:17:13 2019
NAMESPACE: kube-system
STATUS: DEPLOYED

RESOURCES:
==> v1/ConfigMap
NAME                DATA  AGE
elasticsearch       4     2d
elasticsearch-test  1     2d

==> v1/ServiceAccount
NAME                  SECRETS  AGE
elasticsearch-client  1        2d
elasticsearch-data    1        2d
elasticsearch-master  1        2d

==> v1/Service
NAME                     TYPE       CLUSTER-IP     EXTERNAL-IP  PORT(S)   AGE
elasticsearch-client     ClusterIP  10.200.180.10         9200/TCP  2d
elasticsearch-discovery  ClusterIP  None                  9300/TCP  2d

==> v1beta1/Deployment
NAME                  DESIRED  CURRENT  UP-TO-DATE  AVAILABLE  AGE
elasticsearch-client  2        2        2           2          2d

==> v1beta1/StatefulSet
NAME                  DESIRED  CURRENT  AGE
elasticsearch-data    2        2        2d
elasticsearch-master  3        3        2d

==> v1/Pod(related)
NAME                                   READY  STATUS   RESTARTS  AGE
elasticsearch-client-6bb89766f9-wfbxh  1/1    Running  0         2d
elasticsearch-client-6bb89766f9-xvz6c  1/1    Running  0         2d
elasticsearch-data-0                   1/1    Running  0         2d
elasticsearch-data-1                   1/1    Running  0         2d
elasticsearch-master-0                 1/1    Running  0         2d
elasticsearch-master-1                 1/1    Running  0         2d
elasticsearch-master-2                 1/1    Running  0         2d

NOTES:
The elasticsearch cluster has been installed.

Elasticsearch can be accessed:

  * Within your cluster, at the following DNS name at port 9200:

    elasticsearch-client.kube-system.svc

  * From outside the cluster, run these commands in the same shell:

    export POD_NAME=$(kubectl get pods --namespace kube-system -l "app=elasticsearch,component=client,release=elasticsearch" -o jsonpath="{.items[0].metadata.name}")
    echo "Visit http://127.0.0.1:9200 to use Elasticsearch"
    kubectl port-forward --namespace kube-system $POD_NAME 9200:9200
image:
  # repository: "k8s.harbor.maimaiti.site/system/kibana-oss"
  repository: "k8s.harbor.maimaiti.site/system/kibana"
  tag: "6.7.0"
  pullPolicy: "IfNotPresent"

testFramework:
  image: "dduportal/bats"
  tag: "0.4.0"

commandline:
  args: []

env: {}
  # All Kibana configuration options are adjustable via env vars.
  # To adjust a config option to an env var uppercase + replace `.` with `_`
  # Ref: https://www.elastic.co/guide/en/kibana/current/settings.html
  #
  # ELASTICSEARCH_URL: http://elasticsearch-client:9200
  # SERVER_PORT: 5601
  # LOGGING_VERBOSE: "true"
  # SERVER_DEFAULTROUTE: "/app/kibana"

files:
  kibana.yml:
    ## Default Kibana configuration from kibana-docker.
    server.name: kibana
    server.host: "0"
    elasticsearch.url: http://elasticsearch-client.kube-system:9200

    ## Custom config properties below
    ## Ref: https://www.elastic.co/guide/en/kibana/current/settings.html
    # server.port: 5601
    # logging.verbose: "true"
    # server.defaultRoute: "/app/kibana"

deployment:
  annotations: {}

service:
  type: NodePort
  nodePort: 30001
  # clusterIP: None
  # portName: kibana-svc
  externalPort: 443
  internalPort: 5601
  # authProxyPort: 5602 To be used with authProxyEnabled and a proxy extraContainer
  ## External IP addresses of service
  ## Default: nil
  ##
  # externalIPs:
  # - 192.168.0.1
  #
  ## LoadBalancer IP if service.type is LoadBalancer
  ## Default: nil
  ##
  # loadBalancerIP: 10.2.2.2
  annotations: {}
    # Annotation example: setup ssl with aws cert when service.type is LoadBalancer
    # service.beta.kubernetes.io/aws-load-balancer-ssl-cert: arn:aws:acm:us-east-1:EXAMPLE_CERT
  labels: {}
    ## Label example: show service URL in `kubectl cluster-info`
    # kubernetes.io/cluster-service: "true"
  ## Limit load balancer source ips to list of CIDRs (where available)
  # loadBalancerSourceRanges: []
  selector: {}

ingress:
  enabled: false
  # hosts:
    # - kibana.localhost.localdomain
    # - localhost.localdomain/kibana
  # annotations:
  #   kubernetes.io/ingress.class: nginx
  #   kubernetes.io/tls-acme: "true"
  # tls:
    # - secretName: chart-example-tls
    #   hosts:
    #     - chart-example.local

serviceAccount:
  # Specifies whether a service account should be created
  create: true
  # The name of the service account to use.
  # If not set and create is true, a name is generated using the fullname template
  # If set and create is false, the service account must be existing
  name:

livenessProbe:
  enabled: false
  path: /status
  initialDelaySeconds: 30
  timeoutSeconds: 10

readinessProbe:
  enabled: false
  path: /status
  initialDelaySeconds: 30
  timeoutSeconds: 10
  periodSeconds: 10
  successThreshold: 5

# Enable an authproxy. Specify container in extraContainers
authProxyEnabled: false

extraContainers: |
# - name: proxy
#   image: quay.io/gambol99/keycloak-proxy:latest
#   args:
#     - --resource=uri=/*
#     - --discovery-url=https://discovery-url
#     - --client-id=client
#     - --client-secret=secret
#     - --listen=0.0.0.0:5602
#     - --upstream-url=http://127.0.0.1:5601
#   ports:
#     - name: web
#       containerPort: 9090

extraVolumeMounts: []

extraVolumes: []

resources: {}
  # limits:
  #   cpu: 100m
  #   memory: 300Mi
  # requests:
  #   cpu: 100m
  #   memory: 300Mi

priorityClassName: ""

# Affinity for pod assignment
# Ref: https://kubernetes.io/docs/concepts/configuration/assign-pod-node/#affinity-and-anti-affinity
# affinity: {}

# Tolerations for pod assignment
# Ref: https://kubernetes.io/docs/concepts/configuration/taint-and-toleration/
tolerations: []

# Node labels for pod assignment
# Ref: https://kubernetes.io/docs/user-guide/node-selection/
nodeSelector: {}

podAnnotations: {}
replicaCount: 1
revisionHistoryLimit: 3

# Custom labels for pod assignment
podLabels: {}

# To export a dashboard from a running Kibana 6.3.x use:
# curl --user : -XGET https://kibana.yourdomain.com:5601/api/kibana/dashboards/export?dashboard= > my-dashboard.json
# A dashboard is defined by a name and a string with the json payload or the download url
dashboardImport:
  enabled: false
  timeout: 60
  xpackauth:
    enabled: true
    username: myuser
    password: mypass
  dashboards: {}
    # k8s: https://raw.githubusercontent.com/monotek/kibana-dashboards/master/k8s-fluentd-elasticsearch.json

# List of plugins to install using initContainer
# NOTE : We notice that lower resource constraints given to the chart + plugins are likely not going to work well.
plugins:
  # set to true to enable plugins installation
  enabled: false
  # set to true to remove all kibana plugins before installation
  reset: false
  # Use  to add/upgrade plugin
  values:
    # - elastalert-kibana-plugin,1.0.1,https://github.com/bitsensor/elastalert-kibana-plugin/releases/download/1.0.1/elastalert-kibana-plugin-1.0.1-6.4.2.zip
    # - logtrail,0.1.31,https://github.com/sivasamyk/logtrail/releases/download/v0.1.31/logtrail-6.6.0-0.1.31.zip
    # - other_plugin

persistentVolumeClaim:
  # set to true to use pvc
  enabled: false
  # set to true to use you own pvc
  existingClaim: false
  annotations: {}

  accessModes:
    - ReadWriteOnce
  size: "5Gi"
  ## If defined, storageClassName:
  ## If set to "-", storageClassName: "", which disables dynamic provisioning
  ## If undefined (the default) or set to null, no storageClassName spec is
  ##   set, choosing the default provisioner.  (gp2 on AWS, standard on
  ##   GKE, AWS & OpenStack)
  ##
  # storageClass: "-"

# default security context
securityContext:
  enabled: false
  allowPrivilegeEscalation: false
  runAsUser: 1000
  fsGroup: 2000

extraConfigMapMounts: []
  # - name: logtrail-configs
  #   configMap: kibana-logtrail
  #   mountPath: /usr/share/kibana/plugins/logtrail/logtrail.json
  #   subPath: logtrail.json

# Add your own init container or uncomment and modify the given example.
initContainers: {}
  ## Don't start kibana till Elasticsearch is reachable.
  ## Ensure that it is available at http://elasticsearch:9200
  ##
  # es-check:  # <- will be used as container name
  #   image: "appropriate/curl:latest"
  #   imagePullPolicy: "IfNotPresent"
  #   command:
  #     - "/bin/sh"
  #     - "-c"
  #     - |
  #       is_down=true
  #       while "$is_down"; do
  #         if curl -sSf --fail-early --connect-timeout 5 http://elasticsearch:9200; then
  #           is_down=false
  #         else
  #           sleep 5
  #         fi
  #       done
Task not serializable是Spark开发过程最令人头疼的问题之一,这里记录下出现这个问题的两个实例,一个是自己遇到的,另一个是stackoverflow上看到。等有时间了再仔细探究出现Task not serialiazable的各种原因以及出现问题后如何快速定位问题的所在,至少目前阶段碰到此类问题,没有什么章法
1.
package spark.exampl
mysql 查看当前正在执行的操作,即正在执行的sql语句的方法为:
show processlist 命令
mysql> show global status;可以列出MySQL服务器运行各种状态值,我个人较喜欢的用法是show status like '查询值%';一、慢查询mysql> show variab
1. 只有Map任务的Map Reduce Job
File System Counters
FILE: Number of bytes read=3629530
FILE: Number of bytes written=98312
FILE: Number of read operations=0
FILE: Number of lar
import java.util.LinkedList;
import java.util.List;
import ljn.help.*;
public class BTreeLowestParentOfTwoNodes {
public static void main(String[] args) {
/*
* node data is stored in
本文介绍Java API 中 Date, Calendar, TimeZone和DateFormat的使用,以及不同时区时间相互转化的方法和原理。
问题描述:
向处于不同时区的服务器发请求时需要考虑时区转换的问题。譬如,服务器位于东八区(北京时间,GMT+8:00),而身处东四区的用户想要查询当天的销售记录。则需把东四区的“今天”这个时间范围转换为服务器所在时区的时间范围。
入口脚本
入口脚本是应用启动流程中的第一环,一个应用(不管是网页应用还是控制台应用)只有一个入口脚本。终端用户的请求通过入口脚本实例化应用并将将请求转发到应用。
Web 应用的入口脚本必须放在终端用户能够访问的目录下,通常命名为 index.php,也可以使用 Web 服务器能定位到的其他名称。
控制台应用的入口脚本一般在应用根目录下命名为 yii(后缀为.php),该文