bokeh
from bokeh.io import output_notebook, output_file, show
from bokeh.charts import Scatter, Bar, BoxPlot, Chord
from bokeh.layouts import row

import seaborn as sns
# 导入数据
exercise = sns.load_dataset('exercise')

output_notebook()
#output_file('test.html')
- bokeh.charts
# 散点图
p = Scatter(data=exercise, x='id', y='pulse', title='exercise dataset')
show(p)

bokeh_plot.png
# 柱状图
p = Bar(data=exercise, values='pulse', label='diet', stack='kind', title='exercise dataset')
show(p)

bokeh_plot(1).png
# 盒子图
box1 = BoxPlot(data=exercise, values='pulse', label='diet', color='diet', title='exercise dataset')
box2 = BoxPlot(data=exercise, values='pulse', label='diet', stack='kind', color='kind', title='exercise dataset')
show(row(box1, box2))

bokeh_plot(2).png
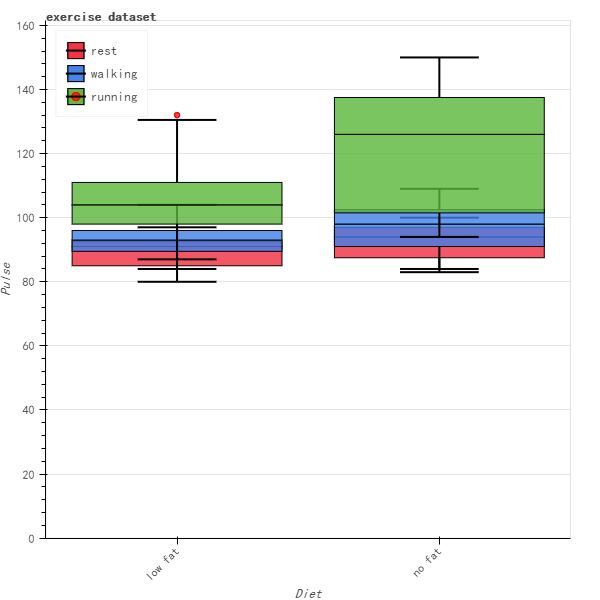
bokeh_plot(3).png
# 弦图 Chord
chord1 = Chord(data=exercise, source="id", target="kind")
chord2 = Chord(data=exercise, source="id", target="kind", value="pulse")

show(row(chord1, chord2))
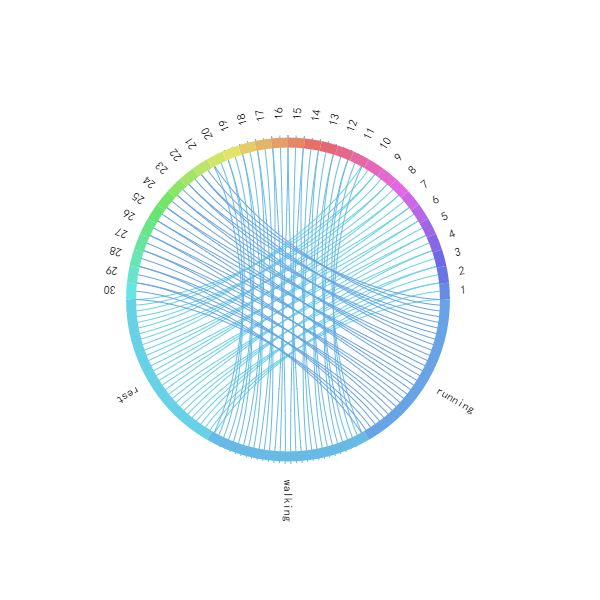
bokeh_plot(4).png
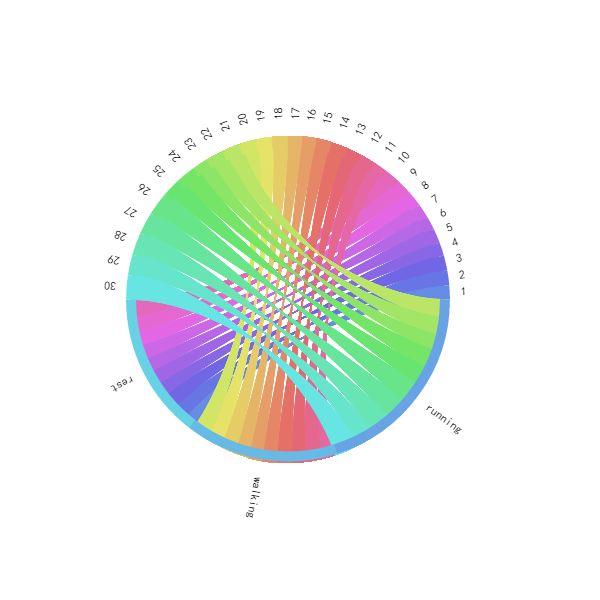
bokeh_plot(5).png
- bokeh.plotting
from bokeh.plotting import figure
import numpy as np

p = figure(plot_width=400, plot_height=400)
# 方框
p.square(np.random.randint(1,10,5), np.random.randint(1,10,5), size=20, color="navy")

# 圆形
p.circle(np.random.randint(1,10,5), np.random.randint(1,10,5), size=10, color="green")
show(p)

bokeh_plot(6).png