SoapUI压力测试的指标项说明以及对测试策略的诠释
如图:
1. Simple Strategy - Baseline, Load and Soak Testing
The Simple Strategy runs the specified number of threads with the specified delay between each run to simulate a "breathing space" for the server. For example if you want to run a functional test with 10 threads with 10 seconds delay, set Threads to 10, delay to 10000 and random to how much of the delay you want to randomize (ie setting it to 0.5 will result in delays between 5 and 10 seconds). When creating a new LoadTest this is the default strategy and set at a relatively low load (5 threads with 1000ms delay).
The Simple Strategy is perfect for Baseline testing. Use it to assert the the basic performance of your service and validate that there are no threading or resource locking issues. Ramp up the number of threads when you want do more elaborate load testing or use the strategy for long-running soak tests.
Since it isn't meant to bring your services to their knees, a setup like this can be used for continuous load-testing to ensure that your service performs as expected under moderate load; set up a baseline test with no randomization of the delay, add LoadTest Assertions that act as a safety net for unexpected results and automate its execution with the command-line LoadTest runner or maven plugins.
2. Fixed Rate Strategy – Simple with a twist
One thing that the Simple Strategy does not do is guarantee a number of executions within a certain time, for example if you might want to start your TestCase 10 times each second no matter how long it takes to execute. Using the Simple Strategy you could set up 10 Threads and a delay compensating for the average gap between the end of the TestCase and the start of the next second, but this would be highly unreliable over time. The Fixed-Rate strategy should be used instead; set the rate as desired (10 in our case) and off you go; the strategy will automatically start the required number threads for this setting attempting to maintain the configured value.
As hinted in the headline, there are some twists here: what if our TestCase takes more than one second to execute? To maintain the configured TPS value, the strategy will internally start new threads to compensate for this; after a while you might have many more than 10 threads running due to the fact that the original ones had not finished within the set rate. And not surprisingly this could cause the target service to get even slower, resulting in more and more threads being started to "keep up" with the configured TPS value. As you probably guessed the "Max Threads" setting is her to prevent soapUI from overloading (both itself and the target services) in this situation, specifying a value here will put a limit on the maximum number of threads the soapUI will be allowed to start to maintain the configured TPS, if reached the existing threads will have to finish before soapUI will start any new ones.
The "Request Level" setting will attempt to maintain the TPS not on the TestCase execution level but on the request level instead, for example if you have a data-driven LoadTest or a TestCase with many requests, you want the TPS setting to apply not on the execution level of the entire TestCase but on the request level.
In any case, the Fixed Rate strategy is useful for baseline, load and soak-testing if you don’t run into the "Thread Congestion" problem described above. On the other hand, you might provoke the congestion (maybe even in combination with another LoadTest) to see how your services handle this or how they recover after the congestion has been handled.
3. Variable Load Strategies
There are several strategies that can be used to vary load (the number of threads) over time, each simulating a different kind of behavior. They can be useful for recovery and stress testing, but just as well for baseline testing, either on their own or in combination with other strategies. Let's have a quick look:
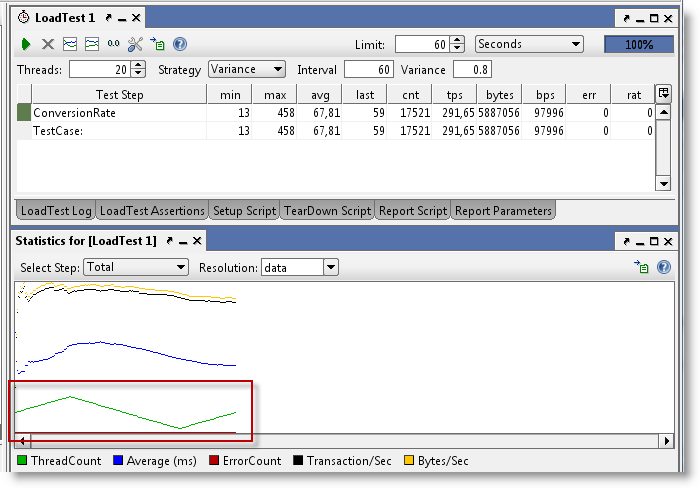
- Variance strategy – this varies the number of threads over time in a “sawtooth” manor as configured; set the Interval to the desired value and the Variance to the how much the number of threads should decrease and increase. For example if we start with 20 threads, set interval to 60 and Variance to 0.8, the number of threads will increase from 20 to 36 within the first 15 seconds, then decrease back to 20 and continue down to 4 threads after 45 seconds, and finally go back up to the initial value after 60 seconds. In the Statistics Diagrams we can follow this variance easily:
- Burst Strategy - this strategy is specifically designed for Recovery Testing and takes variance to its extreme; it does nothing for the configured Burst Delay, then runs the configured number of threads for the “Burst Duration” and goes back to sleep. Here you could (and should!) set the number of threads to a high value (20+) to simulate an onslaught of traffic during a short interval, then measure the recovery of your system with a standard base-line LoadTest containing basic performance-related assertions. Lets try this with a burst delay and duration of 10 seconds for 60 seconds;
Here can see the bursts of activity in the diagram, please also note that the resolution has been changed to 250ms (from the default "data" value), otherwise we not have had any diagram updates during the "sleeping" periods of the execution (since no data would have been collected).
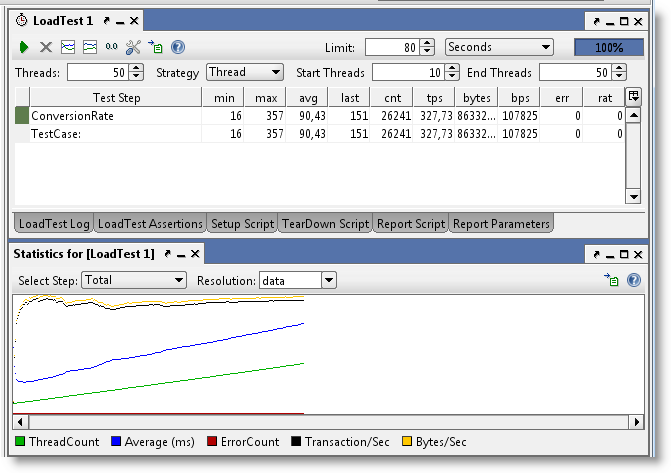
- The Thread Strategy lets you linearly change the number of threads from one level to another over the run of the LoadTest. It’s main purpose is as a means to identify at which level certain statistics change or events occur, for example to find at which ThreadCount the maximum TPS or BPS can be achieved or to find at which ThreadCount functional testing errors start occurring. Set the start and end thread values (for example 5 to 50) and set the duration to a relatively long duration (I use at least 30 seconds per thread value, in this example that would be 1350 seconds) to get accurate measurements (more on this below).
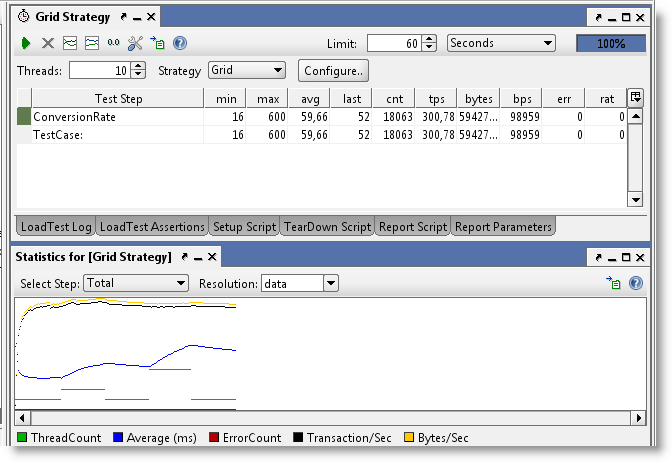
- Grid Strategy – this strategy allows to specifically configure the relative change in number of threads over time, its main use for this is more advanced scenario and recovery testing, where you need to see the services behavior under varying loads and load changes. For example lets say you want to run for 60 seconds with 10, 20, 10, 40, 10 threads. Configure your LoadTest to start with 10 threads and then enter the following values in the Grid:
Both values are stored relative to the duration and actual ThreadCount of the LoadTest; if you change these, the corresponding Grid Strategy values will be recalculated. Running the test shows the following output:
- Script Strategy – the script strategy is the ultimate customization possibility; the script you specify is called regularly (The "Strategy Interval" setting in the LoadTest Options dialog) and should return the desired number of threads at that current time. Returning a value other than the current one will start or stop threads to adjust for the change. This allows for any kind of variance of the number of threads, for example the following script randomizes the number of threads between 5 and 15.
Running this with the strategy interval set to 5000 the number of threads will change every 5 seconds:
The possibilities here are endless.
4. Statistics Calculation and ThreadCount Changes
Many of these strategies will change the number of threads which has an important impact on the statistics calculation that you need to be aware of; when the number of threads changes, this will usually change the response times of the target services, resulting in a change in avg, tps, etc. but since the LoadTest has already run at a previous number of threads the results for those runs will skew the result for the new ThreadCount.
For example lets say you have been running at 5 threads and got and average to 500ms. Using the Thread Strategy you increase the number of threads gradually; when running 6 threads the average increases to 600ms but since the “old” values collected for 5 threads are still there, these will in total result in a lower average. There are two easy ways to work around this; select the “Reset Statistics on ThreadCount change” value in the LoadTest Options dialog, or manually reset the statistics with the corresponding button in the LoadTest toolbar; in either case old statistics will be discarded. To see this in action lets do a ThreadCount Strategy test from 10 to 20 threads over 300 seconds (30 seconds per thread), below you can see results both with this setting unchecked and then checked;
In the latter you see the “jumps” in statistics each time they are reset when the number of threads changes, gradually leveling out to a new value. The final TPS calculated at 20 threads differs about 10% between these two, showing how the lower results “impact” the higher ones.
5. Running Multiple LoadTests Simultaneously
Ok, lets have a quick look at this; we'll create one baseline test with the simple strategy and a low number of threads, and at the same time run a burst strategy to see how the baseline test performance "recovers" after the burst;
Here you can see the simple strategy (bottom diagram) recovering gradually after each burst of load.
6. Final Words
Hopefully you have gotten a good overview of the different strategies in soapUI and how they can be used to simulate different scenarios and kinds of load. As you may have noticed, soapUI focuses more on "behavioral" LoadTesting (understanding how your services handler different loads) instead of exact numbers, which is anyhow hard to calculate since there are so many external factors influencing it.


