纽约Airbnb房源数据挖掘与房价预测评估模型
Airbnb房价数据分析
数据集来自kaggle
下载链接:https://www.kaggle.com/dgomonov/new-york-city-airbnb-open-data
数据集介绍:
该数据集为2008-2019年美国地区公开的Airbnb民宿数据。
1.导包和数据读取
导包
import numpy as np
import pandas as pd
import matplotlib.pyplot as plt
import seaborn as sns
%matplotlib inline
#读取数据
data = pd.read_csv('./AB_NYC_2019.csv')
2.数据的初步探索
2.1获得数据的基本信息
# 查看数据集大小和特征组成
print('Shape:',data.shape)
print('Columns:',data.columns.tolist())
data.head()
输出
Shape: (48895, 16)
Columns: [‘id’, ‘name’, ‘host_id’, ‘host_name’, ‘neighbourhood_group’, ‘neighbourhood’, ‘latitude’, ‘longitude’, ‘room_type’, ‘price’, ‘minimum_nights’, ‘number_of_reviews’, ‘last_review’, ‘reviews_per_month’, ‘calculated_host_listings_count’, ‘availability_365’]
获取数据类型
#获得特征的数据类型
data.info()
输出
RangeIndex: 48895 entries, 0 to 48894
Data columns (total 16 columns):
id 48895 non-null int64
name 48879 non-null object
host_id 48895 non-null int64
host_name 48874 non-null object
neighbourhood_group 48895 non-null object
neighbourhood 48895 non-null object
latitude 48895 non-null float64
longitude 48895 non-null float64
room_type 48895 non-null object
price 48895 non-null int64
minimum_nights 48895 non-null int64
number_of_reviews 48895 non-null int64
last_review 38843 non-null object
reviews_per_month 38843 non-null float64
calculated_host_listings_count 48895 non-null int64
availability_365 48895 non-null int64
dtypes: float64(3), int64(7), object(6)
将时间转为时间格式(datet ime)
data['last_review'] = pd.to_datetime(data['last_review'], infer_datetime_format=True)
初步分析
数据包含48895个样本, 16个特征,包括房主和房间信息、房间所在区域、地理位置、房间类型、预定要求以及评论数量等信息。
16个特征分别为:
id: listing ID
name: name of the listing
host_id: host ID
host_name: name of the host
neighbourhood_group: location(区域)
neighbourhood : area(地区)
latitude : latitude coordinates(维度坐标)
longitude: longitude coordinates(经度坐标)
room_type: listing space type(房间类型)
price: price in dollars(订房价格)
minimum_nights: amount of nights minimum(最少预定天数)
number_of_reviews: number of reviews(评论数量)
last_review: latest review(最新评论时间)
reviews_per_month: number of reviews per month(每月评论数量)
calculated_host_listings_count: amount of listing per host(每个房主拥有的房间数)
availability_365: number of days when listing is available for booking(可以预定的天数)
2.2 缺失值的分析和处理
使用pandas生成各特征缺失值数据的DataFrame
#1.统计各个特征缺失的数量
total = data.isnull().sum().sort_values(ascending=False)
# 2.统计缺失数量占样本数量的百分数
percent=(data.isnull().sum()/data.isnull().count()).sort_values(ascending=False)
missing_data = pd.concat([total,precent], axis=1, key=['Total', 'Percent']).sort_values('Total', ascending=False)
missing_data
输出
分析:
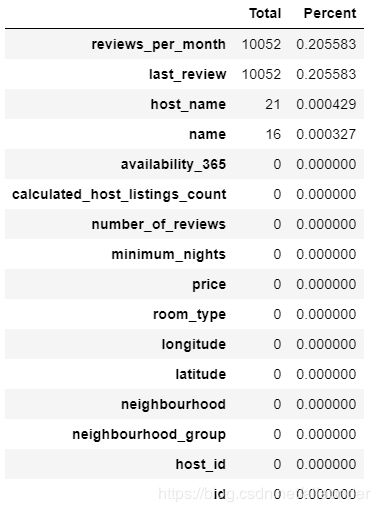
有缺失值的特征包括:每月评论数量、最新评论时间、房间名、房主名。
1.房间名称、房主名的缺失相对较少,考虑房间和房东的名字对数据建模的贡献不大,所以将这两列删除掉。
Combined_data.drop(['host_name','name'], axis=1, inplace=True)
2.每月评论数量、最新评论时间的缺失值相对较多,占到整个样本数量的20%,删除缺失值所在的样本会损失很多数据。
且从理论上来讲,评论数量的多少可能和房价之间存在着不可描述的关系,所以删除特征列也不妥。那就只能填补缺失值了。
再进一步分析,如果某些房间没有评论,那么自然最新评论时间和每月评论数量都会为0。所以我们不妨看一下,这个缺失是不是由于0评论导致的
data[data.reviews_per_month==0.0].shape()
输出
(10052, 14)
看来果然是这样,所以考虑用0填补reviews_per_month 并用整个数据集最早的评论时间填补last_review
data['reviews_per_month'] = data['reviews_per_month'].fillna(0)
earliest = min(data['last_review'])
data['last_review'] = data['last_review'].fillna(earliest)
为了方便分析建模,将last_review转为数值型
data['last_review'] = data['last_review'].apply(lambda x:x.toordinal() - earliest.toordinal())
再次检查是否存在缺失值
total = data.isnull().sum().sort_values(ascending=False)
percent=(data.isnull().sum()/data.isnull().count()).sort_values(ascending=False)
missing_data = pd.concat([total,precent], axis=1, key=['Total', 'Percent']).sort_values('Total', ascending=False)
missing_data
输出
3.样本特征的进一步探索(特征的分布、相互之间的相关性)
按columns的顺序依次对每个特征进行分析
# 获得所有的特征名称
data.columns.tolist()
输出
[‘id’,
‘host_id’,
‘neighbourhood_group’,
‘neighbourhood’,
‘latitude’,
‘longitude’,
‘room_type’,
‘price’,
‘minimum_nights’,
‘number_of_reviews’,
‘last_review’,
‘reviews_per_month’,
‘calculated_host_listings_count’,
‘availability_365’]
3.1 对host_id进行探索
查看不重复的host_id 的数量
total = len(data['host_id'].unique())
percent = len(data['host_id'].unique())/data.shape[0]
print(f'Unique num of host_id:{total}')
print(f'precent:{percent}')
输出
Unique num of host_id:37414
precent:0.7662563745468696
分析
不同的host_id数量较多,占整个数据集样本数量的76%,且host_id属于离散型数据,对于建模的意义并不大,且会影响模型的效果,所以考虑将该特征删除。
基于同样的考虑,将id也删除掉
data = data.drop(columns=['host_id', 'id'], axis=1)
3.2 对neighborhood_group进行探索
对城市群数据进行统计
data['neighbourhood_group'].value_counts()
输出
Manhattan 21618
Brooklyn 20082
Queens 5665
Bronx 1090
Staten Island 372
Name: neighbourhood_group, dtype: int64
数据可视化
sns.catplot(x='neighborhood_group', kind='count', data=data)
fig = plt.gca()
fig.set_size_inches()
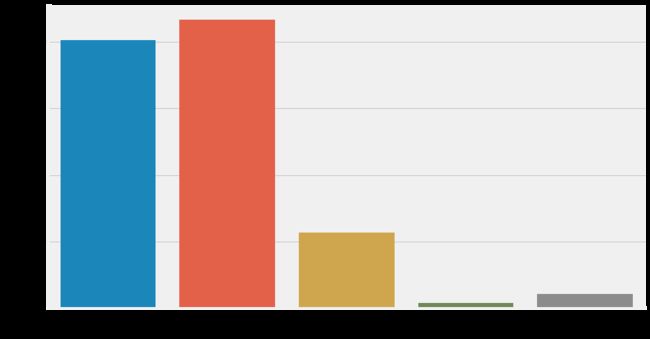
可以看出,房间主要分布在曼哈顿和布鲁克林。这样的分布是合理的,曼哈顿为纽约五大行政区中人口最密集的区,而布鲁克林则为纽约人口最多的地区。
3.3 对经纬度分布进行探索
fig, axes = plt.subplots(1,2, figsize=(21,6))
sns.distplot(data['latitude'], ax=axes[0])
sns.distplot(data['longitude'], ax=axes[1])
sns.scatterplot(x= data['latitude'], y=data['longitude'])
3.4 对房间类别数据进行探索
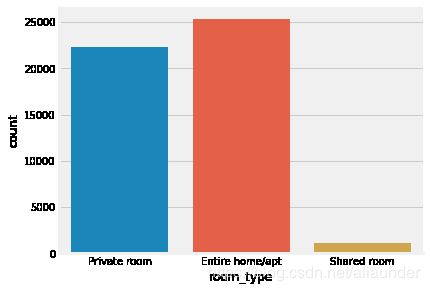
sns.catplot(x='room_type',  kind='count', data=data)
fig = plt.gca()
fig.set_size_inches(16,6)
3.5 对Minimum nights 进行分析
fig,ax=plt.subplots(figsize=(16,8))
sns.distplot(data['minimum_nights'],kde=False,rug=True)
ax.set_title('Counts of minimum nights',fontsize=16)
ax.tick_params(labelsize=13)
ax.set_xlabel('minimum nights', fontsize=15)
ax.set_ylabel('Sample size statistics',fontsize=15)
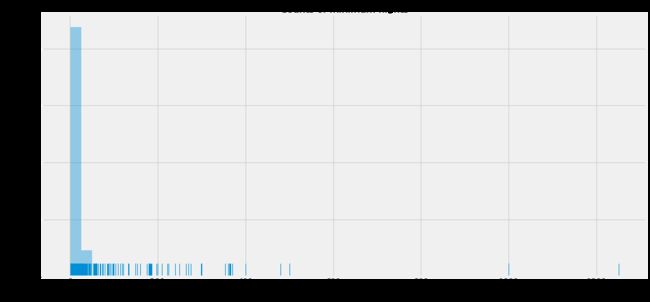
可以看出,数据呈现非常严重的偏态分布,大多数房间要求入住最少天数的值较小。因此,使用描述性统计进行进一步观察
data['minimum_nights'].describe(percentiles=[.25, .5, .75, .95, .99])
count 48827.000000
mean 7.015176
std 20.486139
min 1.000000
25% 1.000000
50% 3.000000
75% 5.000000
95% 30.000000
99% 45.000000
max 1250.000000
可以看出百分之99的数据都集中在45以内。对于严重的偏态数据,可以使用numpy中的log1p()函数进行处理,其中:
fig,ax=plt.subplots(figsize=(16,8))
ax.set_yscale('log')
sns.distplot(np.log1p(data['minimum_nights']),rug=True,kde=False)
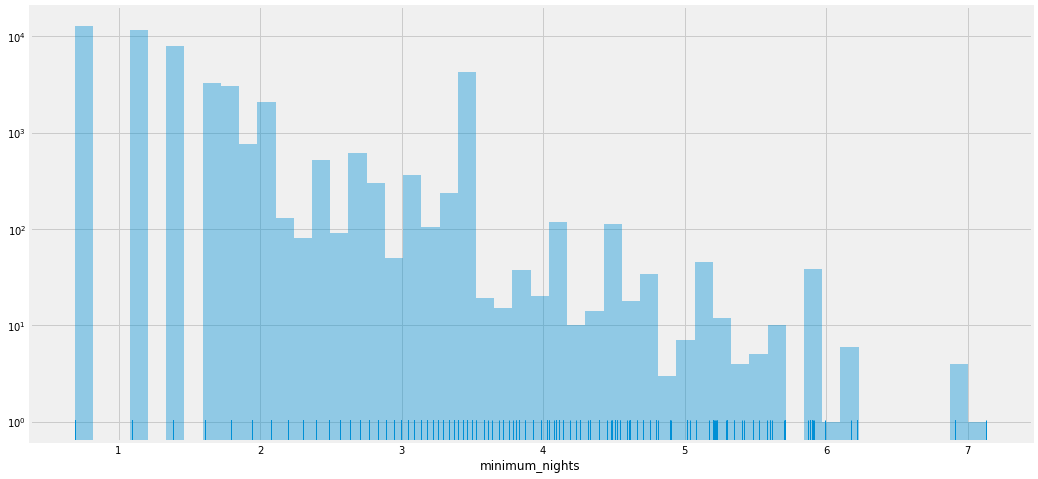
使用np.log1p可以一定程度上缓解数据的偏态性,所以将Minimum nights数据进行转换
Combined_data['minimum_nights'] = np.log1p(Combined_data['minimum_nights'])
3.6 Reviews per month
fig,ax=plt.subplots(1,2,figsize=(20,6))
sns.distplot(data['reviews_per_month'],rug=True,kde=False,ax=ax[0])
ax[0].set_title('Count of reviews per month',fontsize=17)
ax[0].set_ylabel('Count',fontsize=17)
ax[0].set_xlabel('Review per month',fontsize=17)
ax[0].tick_params(labelsize=14)

sns.distplot(np.log1p(data['reviews_per_month']),rug=True,kde=False,ax=ax[1])
ax[1].set_title('log :Count of review per month')
ax[1].set_title('Count of reviews per month',fontsize=17)
ax[1].set_ylabel('Count',fontsize=17)
ax[1].set_xlabel('log:Review per month',fontsize=17)
ax[1].tick_params(labelsize=14)

Reviews per month 数据的偏态非常严重,即使进行对数处理,也呈现出非常严重的偏态分布。
观察统计描述
data['reviews_per_month'].describe(percentiles=[.25, .5, .75, .95, .99])
count 48827.000000
mean 1.091718
std 1.597558
min 0.000000
25% 0.040000
50% 0.370000
75% 1.590000
95% 4.310000
99% 6.800000
max 58.500000
Name: reviews_per_month, dtype: float64
99%的样本,月平均评论数量在7条以内。这说明大多数的房源评论数量是非常少的,而只有少数样本具有很大的月评论量。这里推测:月评论数量可能和minimum_nights 以及后面的 availability_365存在相关性,因为如果房间的最短预定时间较长,完成订单的用户数量会相对较少,而一年之内如果可预订的时间较少,也会造成月评论数量较少。这一部分推论将在后面的分析中进一步探究。
3.7 Availability 365
fig, axes = plt.subplots(1,1,figsize=(18.5, 6))
sns.distplot(data['availability_365'], rug=False, kde=True, color="blue", ax=axes)
axes.set_xlabel('availability_365')
axes.set_xlim(0, 365)

样本的可预订天数在15天内的数量较多,其余天数的数量都较少,但是分布没有呈现间断的偏态。
3.8 calculated_host_listings_count
fig,ax=plt.subplots(1,1,figsize=(16,8))
sns.distplot(Combined_data['calculated_host_listings_count'],rug=True,kde=False)
ax.set_yscale('log')
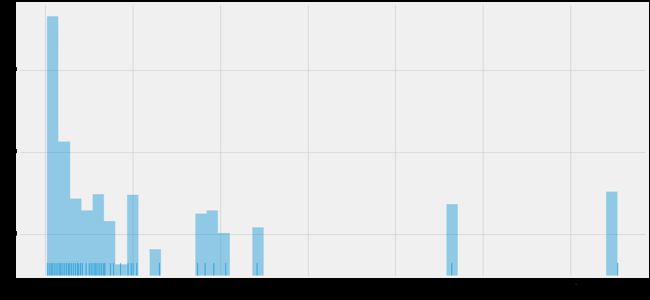
calculated_host_listings_count数据也存在一定程度的偏态。考虑房东拥有的房源数量与其他特征时间的联系并不直观,所以关于这一特征,在后续统计分析中再进一步讨论。
3.9 price
讨论了所以特征的分布之后,接下来对目标列,房间价格的分布进行探索。
fig, axes = plt.subplots(1,3, figsize=(21,6))
sns.distplot(data['price'], ax=axes[0])
sns.distplot(np.log1p(data['price']), ax=axes[1])
axes[1].set_xlabel('log(1+price)')
sm.qqplot(np.log1p(data['price'])#数据
          ,stats.norm#分布方式
          , fit=True#大概就是个自动进行fit的设置:如果fit为true,则dist的参数使用dist.fit自动拟合
          , line='45'#线的设置
          , ax=axes[2]);

可以看出借用np.log1p函数 可以将房间价格数据的分布转换成近似的高斯分布。
Combined_data['price'] = np.log1p(Combined_data['price'])
4. 特征之间的相关性分析
4.1皮尔森相关系数和热力图
对相关性的分析采用皮尔斯相关系数,皮尔森相关系数的大小,可以反映出两个变量之间线性相关的程度。
借助seaborn中的热力图(heatmap)进行可视化。
corrmatrix = data.corr()
f, ax = plt.subplots(figsize=(15,12))
sns.heatmap(corrmatrix, vmax=0.8, square=True,annot=True
分析:
1.从热力图可以看出,总评论数量(number_of_reviews)和每月评论数量(reviews_per_month)的相关性最高,皮尔森系数为0.59;最新评论日期(last_review)和月平均评论量的相关性排第二, 总评论数和最新评论时间的相关性排第三,说明这三个特征之间的关系比较密切,这也是合理的。
2.从负相关来看,月均评论数量确实和最少预定天数之间存在着相对高一点的负相关关系,这与我们在 3.6 Reviews per month的分析一致。
3.房价(price)与经度之间的相关性相较其他特征更高,为-0.33。
4.2 散点图阵
皮尔森相关系数只能反映特征两两之间的线性相关程度,为了更加直观的探究各特征之间的相关性,使用散点图矩阵将特征进行两两之间的可视化。这里只选取数值型数据进行可视化
sns.pairplot(Combined_data.select_dtypes(exclude=['object']),height=3.5)
单独查看房价,经纬度和评论数量的散点图
fig,ax=plt.subplots(1,3,figsize=(16,5))
ax[0].scatter(x=data['number_of_reviews'],y=np.exp(data['price'])-1,alpha=.5)
ax[0].set_xlabel(xlabel='number_of_reviews')
ax[0].set_ylabel(ylabel='price')

ax[1].scatter(x=data['number_of_reviews'],y=data['longitude'],alpha=.5)
ax[1].set_xlabel(xlabel='number_of_reviews')
ax[1].set_ylabel(ylabel='longitude')

ax[2].scatter(x=data['number_of_reviews'],y=data['latitude'],alpha=.5)
ax[2].set_xlabel(xlabel='number_of_reviews')
ax[2].set_ylabel(ylabel='latitude')

分析:
1.总评论数(number_of_reviews)其实从一定程度上能够反映出房源受欢迎的程度。从上图可以看出,在房价500一下的房源相对拥有更多的评论,更受用户欢迎。同时,经度越靠近 -74.0~-73.9区间, 维度越靠近40.7附近的房源,用于更多的评论。
2.房间的最小预定天数越小,房间则拥有更多的评论。
5.建模数据的准备
5.1 object数据哑变量处理
在建模之前首先需要对数据的类型进行处理,首先将分类数据进行哑变量处理。
使用pandas的get_dummies模块可以快速对所有的分类变量哑变量化。
object_features = data.select_dtypes(include=['object'])
object_features.columns
Index([‘neighbourhood_group’, ‘neighbourhood’, ‘room_type’], dtype=‘object’)
非数值化的特征主要有:neighbourhood_group,neighbourhood,room_type 三个。
object_features_oh=pd.get_dummies(object_features)
object_features_oh.head()
5.2 数据集准备
将第一步的哑变量和原数据集的所有数值型数据进行拼接。
#首先提取出所有的数值型数据
num_features = data.select_dtypes(exclude=['object'])
#将房价单独提出
y = num_features.loc[:,'price']
num_features.drop(columns=['price'],axis=1,inplace=True)
#拼接成新的数据集
new_data = pd.concat([num_features,object_features_ht,y],axis=1)
#获取columns列表
new_data.columns.tolist()
获取新数据集的形状
new_data.shape
(48827, 238)
5.3 将处理好的数据集存储
new_data.to_csv('Processed_AB_NYC2019.csv')
6.房价评估模型
6.1 训练集和测试集的准备
from sklearn.model_selection import train_test_split
Xtrain,Xtest,ytrain,ytest = train_test_split(X,y,test_size=0.2,random_state=42)
print(f'The shape of Xtrain:{Xtrain.shape}')
print(f'The shape of Xtest:{Xtest.shape}')
print(f'The shape of ytrain:{ytrain.shape}')
print(f'The shape of ytest:{ytest.shape}')
输出
The shape of Xtrain:(39061, 237)
The shape of Xtest:(9766, 237)
The shape of ytrain:(39061,)
The shape of ytest:(9766,)
6.2 数据的标准化
考虑到该数据集的值存在很多异常,所以选用RobustScaler进行标准化
from sklearn.preprocessing import scale,RobustScaler
y = data.iloc[:,-1]
X = data.iloc[:,:-1]
columns=X.columns.tolist()
scaler=RobustScaler()
X = pd.DataFrame(scaler.fit_transform(X),columns=columns)
X.head()
6.3对训练集数据进行交叉验证
为确保模型的精确度,避免由于训练集和测试集的数据交叉,引起模型得分虚高。这里采用的建模思想是:先对训练集进行建模和交叉验证以及调参,然后将调参后的最优模型用于测试集的预测,这样能最大程度避免过拟合现象的发生。
6.3.1 模型的选择
选择三种回归模型进行效果比对,分别是Ridge回归,Lasso回归,随机森林回归。
from sklearn.model_selection import cross_val_score
from sklearn.linear_model import Ridge,Lasso
from sklearn.ensemble import RandomForestRegressor
6.3.2 模型比对和选择
对比默认参数下,三种模型在训练集上的表现
#创建交叉验证评分函数,一个获得R方,一个获得mse
def r2_score(model):
    return cross_val_score(model,Xtrain,ytrain,cv=8)
def rmse_score(model):
    return cross_val_score(model,Xtrain,ytrain,scoring='neg_mean_squared_error',cv=8)
#三种模型效果对比
Model=[Ridge,Lasso,RandomForestRegressor]
for model in Model:
    cv_r2=r2_score(model())
    cv_rmse_score = rmse_score(model())
    name=str(model)
    print(f'The mean R^2 of cv {name} model:{cv_r2.mean()}')
    print(f'The mean rmse of cv {name} model:{-cv_rmse_score.mean()}')
The mean R^2 of cv
model:0.5672412282287453
The mean rmse of cvmodel:0.20051572334599144
The mean R^2 of cvmodel:0.016420955110503968
The mean rmse of cvmodel:0.45571719193065025
The mean R^2 of cvmodel:0.5769691954139999
The mean rmse of cvmodel:0.194220010674006
Lasso模型的效果有点不太好,为减小工作量这里选择Ridge和随机回归森林模型。
6.3.3 Ridge模型调参
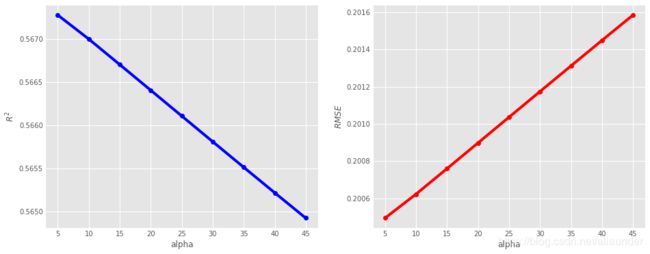
对alpha进行调参,alpha为Ridge模型的惩罚力度,alpha越大惩罚力度越大。
alpha=[i for i in range(5,50,5)]
r2_list=[]
rmse_list=[]
for i in alpha:
    ridge_r2_score=r2_score(Ridge(alpha=i))
    r2_list.append(ridge_r2_score.mean())
    ridge_rmse_score=-rmse_score(Ridge(alpha=i))
    rmse_list.append(ridge_rmse_score.mean())
%matplotlib inline
import matplotlib.style as style
style.use("ggplot")
fig,axes=plt.subplots(1,2,figsize=(14,6))
axes[0].plot(alpha, r2_list,'o-',color='blue')
axes[1].plot(alpha,rmse_list,'o-',color='red')
axes[0].set_xlabel("alpha")
axes[0].set_ylabel("$R^2$")
axes[1].set_xlabel("alpha")
axes[1].set_ylabel("$RMSE$")
plt.subplots_adjust(wspace=0.2,
                   hspace=0.2)
print(f'max R2 is{max(r2_list)},the alpah is {alpha[r2_list.index(max(r2_list))]}')
print(f'min RMSE is{min(rmse_list)},the alpah is {alpha[rmse_list.index(min(rmse_list))]}')
max R2 is0.5672822306807329,the alpah is 5
min RMSE is0.20049424573570954,the alpah is 5
alpha2 = np.linspace(0, 5, 10)
r2_list2=[]
rmse_list2=[]
for i in alpha2:
    ridge_r2_score=r2_score(Ridge(alpha=i))
    r2_list2.append(ridge_r2_score.mean())
    ridge_rmse_score=-rmse_score(Ridge(alpha=i))
    rmse_list2.append(ridge_rmse_score.mean())

fig,axes=plt.subplots(1,2,figsize=(14,4))
axes[0].plot(alpha2, r2_list2,'o-',color='blue')
axes[1].plot(alpha2,rmse_list2,'o-',color='red')

axes[0].set_xlabel("alpha")
axes[0].set_ylabel("$R^2$")
axes[1].set_xlabel("alpha")
axes[1].set_ylabel("$RMSE$")

plt.subplots_adjust(wspace=0.2,
                   hspace=0.2)
print(f'max R2 is{max(r2_list2)},the alpah is {alpha2[r2_list2.index(max(r2_list2))]}')
print(f'min RMSE is{min(rmse_list2)},the alpah is {alpha2[rmse_list2.index(min(rmse_list2))]}')
max R2 is0.5673563596111495,the alpah is 2.7777777777777777
min RMSE is0.2004607031077809,the alpah is 2.7777777777777777
Ridge模型alpha参数最好的取值为2.7,在sklearn库中,Ridge模型的主要参数就是alpha ,因此我们可以获得Ridge的最佳模型及数据集在该模型上的表现
from sklearn.metrics import mean_squared_error, balanced_accuracy_score
best_alpha = alpha2[np.argmax(r2_list2)]
ridge_best = r2_score(Ridge(alpha=best_alpha))
ridge_model = Ridge(alpha=best_alpha)
ridge_model = ridge_model.fit(Xtrain,ytrain)
predict_ytrain = ridge_model.predict(Xtrain)
predict_ytest = ridge_model.predict(Xtest)
ridge_results=pd.DataFrame({'algorithm':['Ridge Regression'],
                           'CV_ridge_r2:':ridge_best.mean(),
                            'train error:':mean_squared_error(predict_ytrain,ytrain),
                            'test error:':mean_squared_error(predict_ytest,ytest)
                           }
)
ridge_results
6.4 随机森林回归模型
默认参数模型评分
base_rfr_cv = r2_score(RandomForestRegressor(random_state=42))
base_rfr_model=RandomForestRegressor(random_state=42)
base_rfr_model = base_rfr_model.fit(Xtrain,ytrain)
rfr_predict_ytrain = base_rfr_model.predict(Xtrain)
rfr_predict_ytest = base_rfr_model.predict(Xtest)
base_rfr_result=pd.DataFrame({'model':['RandomForestRegressor'],
                'CV_rfr_r2:':base_rfr_cv.mean(),
                'train error:':mean_squared_error(rfr_predict_ytrain,ytrain),
                'test error:':mean_squared_error(rfr_predict_ytest,ytest)})
base_rfr_result
base_rfr_model.get_params()
{‘bootstrap’: True,
‘criterion’: ‘mse’,
‘max_depth’: None,
‘max_features’: ‘auto’,
‘max_leaf_nodes’: None,
‘min_impurity_decrease’: 0.0,
‘min_impurity_split’: None,
‘min_samples_leaf’: 1,
‘min_samples_split’: 2,
‘min_weight_fraction_leaf’: 0.0,
‘n_estimators’: 10,
‘n_jobs’: None,
‘oob_score’: False,
‘random_state’: 42,
‘verbose’: 0,
‘warm_start’: False}
数据集的特征比较多逐个搜索工作量有点太大,考虑先用随机搜索RandomSearchCV探索一下
from sklearn.model_selection import  RandomizedSearchCV
n_estimators=[x for x in range(20,2000,20)]
max_depth=[x for x in range(1,10,1)]
max_features=['auto','sqrt']
min_samples_split=[2,4,7]
min_samples_leaf=[1,2,4]
bootstrap=[True,False]
random_grid={'n_estimators':n_estimators,
             'max_features':max_features,
             'max_depth':max_depth,
             'min_samples_split':min_samples_split,
             'min_samples_leaf':min_samples_leaf,
             'bootstrap':bootstrap
}
rf_random = RandomizedSearchCV(estimator=RandomForestRegressor(random_state=42), param_distributions = random_grid, n_iter=10, cv = 3, verbose=2, random_state=42)
rf_random.fit(Xtrain, ytrain)
查看随机搜索到的最佳模型
best_rfr=rf_random.best_estimator_
best_rfr
RandomForestRegressor(bootstrap=True, criterion=‘mse’, max_depth=7,
max_features=‘auto’, max_leaf_nodes=None,
min_impurity_decrease=0.0, min_impurity_split=None,
min_samples_leaf=2, min_samples_split=7,
min_weight_fraction_leaf=0.0, n_estimators=1960,
n_jobs=None, oob_score=False, random_state=42, verbose=0,
warm_start=False)
模型的n_estimators取1960,相对较大,用最佳模型建模看一下效果
rfr_best_score=r2_score(best_rfr)
rfr_best_model=best_rfr.fit(Xtrain,ytrain)
predict_ytrain_rfr=rfr_best_model.predict(Xtrain)
precict_ytest_rfr = rfr_best_model.predict(Xtest)
rfr_result=pd.DataFrame({'algorithm:':['RandomForestRegressor'],
                        'CV_rfr_r2:':rfr_best_score.mean(),
                        'train error:':mean_squared_error(predict_ytrain_rfr,ytrain),
                        'test error:':mean_squared_error(precict_ytest_rfr,ytest)}
                       )
rfr_result
模型的得分有所提高,但是效果并不是太好,考虑数据集其实存在有很多哑变量,特征比较多,所以考虑用特征选择的方式剔除一部分特征再进行建模看一下效果。
6.4.1 特征选择
为了数据的可解释性,就不用PCA了。
#对整体数据集进行标准化处理
columns=X.columns.tolist()
scaler=RobustScaler()
X = pd.DataFrame(scaler.fit_transform(X),columns=columns)
X.head()
#进行特征选择
from sklearn.feature_selection import VarianceThreshold
selector=VarianceThreshold(.9*(1-.9))
X_var = selector.fit_transform(X)
#获得筛选出特征的columns
X_var_columns = X.columns[selector.get_support(indices=True)]
X_var = pd.DataFrame(X_var,columns=X_var_columns)
X_var.head()
X_var.columns
Index([‘latitude’, ‘longitude’, ‘minimum_nights’, ‘number_of_reviews’,
‘last_review’, ‘reviews_per_month’, ‘calculated_host_listings_count’,
‘availability_365’, ‘neighbourhood_group_Brooklyn’,
‘neighbourhood_group_Manhattan’, ‘neighbourhood_group_Queens’,
‘room_type_Entire home/apt’, ‘room_type_Private room’],
dtype=‘object’)
#再次进行训练集和测试集的划分
Xtrain,Xtest,ytrain,ytest = train_test_split(X,y,test_size=0.3,random_state=42)
6.4.2 随机森林模型调参
调参思想:
随机森林模型中重要的参数有 n_estimators, max_depth, max_features, min_sample_leaf, min_sample_split。
n_estimators 参数决定森林模型中树的数量,而其余参数决定每棵树的特征, 先对后几个参数进行调参,再调n_estimators 会在提高效率的同时得到相对更合理的模型。
首先对 max_depth, max_features, min_sample_leaf, min_sample_split 四个参数进行试探的交叉验证。
from sklearn.metrics import mean_squared_error
from sklearn.model_selection import GridSearchCV
#为避免警告信息,这里现将n_estimators设定为10.
n_estimators=[10]
max_depth=[i for i in range(5,10,2)]
max_features=[i for i in range(5,14,1)]
min_samples_leaf=[i for i in range(2,10,1)]
min_samples_split=[i for i in range(2,5,1)]
parameters = {
    'n_estimators':n_estimators,
    'max_depth':max_depth,
    'max_features':max_features,
    'min_samples_leaf':min_samples_leaf,
    'min_samples_split':min_samples_split
}
rfr = RandomForestRegressor(random_state=42)
GS=GridSearchCV(rfr,parameters,cv=3)
GS.fit(Xtrain,ytrain)
GS.best_params_
输出
{‘max_depth’: 9,
‘max_features’: 9,
‘min_samples_leaf’: 7,
‘min_samples_split’: 2,
‘n_estimators’: 10}
从交叉验证的结果来看,其实min_samples_split就不用调了,所以对其余的参数分布跑学习曲线。
首先,对max_depth跑学习曲线
train_score_list=[]
train_error_list=[]
test_score_list=[]
test_error_list=[]
for i in range(9,29,1):
    model = RandomForestRegressor(max_depth=i,random_state=42).fit(Xtrain,ytrain)
    train_score = model.score(Xtrain,ytrain)
    train_score_list.append(train_score)
    test_score = model.score(Xtest,ytest)
    test_score_list.append(test_score)
    predict_ytrain=model.predict(Xtrain)
    predict_ytest =model.predict(Xtest)
    train_error=mean_squared_error(predict_ytrain,ytrain)
    test_error = mean_squared_error(predict_ytest,ytest)
    train_error_list.append(train_error)
    test_error_list.append(test_error)
数据可视化
import matplotlib.style as style
style.use('ggplot')
x=[i for i in range(9,29,1)]
fig,ax=plt.subplots(2,2,figsize=(10,10))
ax[0][0].plot(x,train_score_list,'o-',linewidth=1.8 ,color='blue')
ax[0][0].set_xlabel(xlabel='n_estimators')
ax[0][0].set_ylabel(ylabel='R square of trainSet')

ax[0][1].plot(x,test_score_list,'o-',linewidth=1.8,color='blue')
ax[0][1].set_xlabel(xlabel='n_estimators')
ax[0][1].set_ylabel(ylabel='R square of testSet')

ax[1][0].plot(x,train_error_list,'o-',linewidth=1.8,color='green')
ax[1][0].set_xlabel(xlabel='n_estimators')
ax[1][0].set_ylabel(ylabel='mse of trainSet')

ax[1][1].plot(x,test_error_list,'o-',linewidth=1.8,color='green')
ax[1][1].set_xlabel(xlabel='n_estimators')
ax[1][1].set_ylabel(ylabel='mse of testSet')
plt.subplots_adjust(
#                     left=0.1
#                     , bottom=0.1
#                     ,right=0.2
#                     ,top=None
#                     ,
    wspace=0.3
                    ,hspace=0.2
                   )
print(f"The min testSet error is {min(test_error_list)} when max_depth = {x[np.argmin(test_error_list)]}")
The min testSet error is 0.1857647297734813 when max_depth = 10
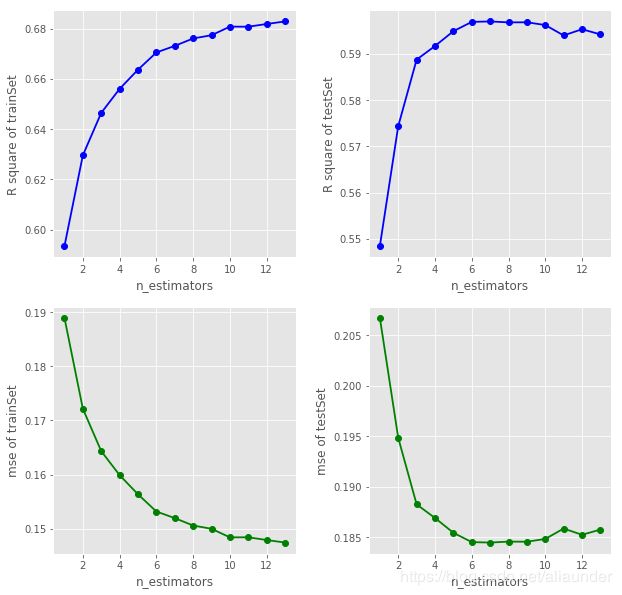
可以看出当max_depth取10时在测试集是表现最好,当max_depth大于10后,随参数的增大,模型在测试集的表现逐渐下降。根据调参规则(偏差方差困境) 我们在此取max_depth=10。
接着,对max_features跑学习曲线
train_score_list2=[]
train_error_list2=[]
test_score_list2=[]
test_error_list2=[]
for i in range(1,14,1):
    model = RandomForestRegressor(max_depth=10,max_features=i,random_state=42).fit(Xtrain,ytrain)
    train_score = model.score(Xtrain,ytrain)
    train_score_list2.append(train_score)
    test_score = model.score(Xtest,ytest)
    test_score_list2.append(test_score)
    predict_ytrain=model.predict(Xtrain)
    predict_ytest =model.predict(Xtest)
    train_error=mean_squared_error(predict_ytrain,ytrain)
    test_error = mean_squared_error(predict_ytest,ytest)
    train_error_list2.append(train_error)
    test_error_list2.append(test_error)
import matplotlib.style as style
style.use('ggplot')
x=[i for i in range(1,14,1)]
fig,ax=plt.subplots(2,2,figsize=(10,10))
ax[0][0].plot(x,train_score_list2,'o-',linewidth=1.8 ,color='blue')
ax[0][0].set_xlabel(xlabel='n_estimators')
ax[0][0].set_ylabel(ylabel='R square of trainSet')

ax[0][1].plot(x,test_score_list2,'o-',linewidth=1.8,color='blue')
ax[0][1].set_xlabel(xlabel='n_estimators')
ax[0][1].set_ylabel(ylabel='R square of testSet')

ax[1][0].plot(x,train_error_list2,'o-',linewidth=1.8,color='green')
ax[1][0].set_xlabel(xlabel='n_estimators')
ax[1][0].set_ylabel(ylabel='mse of trainSet')

ax[1][1].plot(x,test_error_list2,'o-',linewidth=1.8,color='green')
ax[1][1].set_xlabel(xlabel='n_estimators')
ax[1][1].set_ylabel(ylabel='mse of testSet')
plt.subplots_adjust(
#                     left=0.1
#                     , bottom=0.1
#                     ,right=0.2
#                     ,top=None
#                     ,
    wspace=0.3
                    ,hspace=0.2
                   )
print(f"The min testSet error is {min(test_error_list2)} when max_depth = {x[np.argmin(test_error_list2)]}")
The min testSet error is 0.1844789788027811 when max_depth = 7
这里我们锁定max_features=7
min_samples_leaf 学习曲线
train_score_list3=[]
train_error_list3=[]
test_score_list3=[]
test_error_list3=[]
for i in range(6,20,1):
    model = RandomForestRegressor(max_depth=10,min_samples_leaf=i,max_features=7,random_state=42).fit(Xtrain,ytrain)
    train_score = model.score(Xtrain,ytrain)
    train_score_list3.append(train_score)
    test_score = model.score(Xtest,ytest)
    test_score_list3.append(test_score)
    predict_ytrain=model.predict(Xtrain)
    predict_ytest =model.predict(Xtest)
    train_error=mean_squared_error(predict_ytrain,ytrain)
    test_error = mean_squared_error(predict_ytest,ytest)
    train_error_list3.append(train_error)
    test_error_list3.append(test_error)

import matplotlib.style as style
style.use('ggplot')
x=[i for i in range(6,20,1)]
fig,ax=plt.subplots(2,2,figsize=(10,10))
ax[0][0].plot(x,train_score_list3,'o-',linewidth=1.8 ,color='blue')
ax[0][0].set_xlabel(xlabel='n_estimators')
ax[0][0].set_ylabel(ylabel='R square of trainSet')

ax[0][1].plot(x,test_score_list3,'o-',linewidth=1.8,color='blue')
ax[0][1].set_xlabel(xlabel='n_estimators')
ax[0][1].set_ylabel(ylabel='R square of testSet')

ax[1][0].plot(x,train_error_list3,'o-',linewidth=1.8,color='green')
ax[1][0].set_xlabel(xlabel='n_estimators')
ax[1][0].set_ylabel(ylabel='mse of trainSet')

ax[1][1].plot(x,test_error_list3,'o-',linewidth=1.8,color='green')
ax[1][1].set_xlabel(xlabel='n_estimators')
ax[1][1].set_ylabel(ylabel='mse of testSet')
plt.subplots_adjust(
#                     left=0.1
#                     , bottom=0.1
#                     ,right=0.2
#                     ,top=None
#                     ,
    wspace=0.3
                    ,hspace=0.2
                   )
print(f"The min testSet error is {min(test_error_list3)} when min_samples_leaf = {x[np.argmin(test_error_list3)]}")
The min testSet error is 0.18379781652811114 when min_samples_leaf = 18
至此,我们将max_depht, max_features,min_samples_leaf 的最佳取值都锁定了。
检验一下此时模型的效果
model = RandomForestRegressor(max_depth=10,max_features=7,min_samples_leaf=18,random_state=42).fit(Xtrain,ytrain)
print(f'train Score is {model.score(Xtrain,ytrain)}')
print(f'test Score is {model.score(Xtest,ytest)}')
print(f'train mse is {mean_squared_error(model.predict(Xtrain),ytrain)}')
print(f'train mse is {mean_squared_error(model.predict(Xtest),ytest)}')
train Score is 0.636881329970346
test Score is 0.5984682836550419
train mse is 0.1687768411375859
train mse is 0.18379781652811114
对 n_estimators 进行调参
这里一共调整了两次,只展示最后一次调参结果
n_estimators=[i for i in range(30,60,1)]
train_score_list5=[]
test_score_list5=[]
train_error_list5=[]
test_error_list5=[]

for i in n_estimators:
    rfr = RandomForestRegressor(random_state=42,n_estimators=i,max_depth=10,max_features=7,min_samples_leaf=18)
    rfr = rfr.fit(Xtrain,ytrain)
    train_score_list5.append(rfr.score(Xtrain,ytrain))
    test_score_list5.append(rfr.score(Xtest,ytest))
    predict_ytrain = rfr.predict(Xtrain)
    predict_ytest = rfr.predict(Xtest)
    mse_train=mean_squared_error(predict_ytrain,ytrain)
    mse_test=mean_squared_error(predict_ytest,ytest)
    train_error_list5.append(mse_train)
    test_error_list5.append(mse_test)

#可视化
import matplotlib.style as style
style.use('ggplot')
x=[i for i in range(30,60,1)]
fig,ax=plt.subplots(2,2,figsize=(10,10))
ax[0][0].plot(x,train_score_list5,'o-',linewidth=1.8 ,color='blue')
ax[0][0].set_xlabel(xlabel='n_estimators')
ax[0][0].set_ylabel(ylabel='R square of trainSet')

ax[0][1].plot(x,test_score_list5,'o-',linewidth=1.8,color='blue')
ax[0][1].set_xlabel(xlabel='n_estimators')
ax[0][1].set_ylabel(ylabel='R square of testSet')

ax[1][0].plot(x,train_error_list5,'o-',linewidth=1.8,color='green')
ax[1][0].set_xlabel(xlabel='n_estimators')
ax[1][0].set_ylabel(ylabel='mse of trainSet')

ax[1][1].plot(x,test_error_list5,'o-',linewidth=1.8,color='green')
ax[1][1].set_xlabel(xlabel='n_estimators')
ax[1][1].set_ylabel(ylabel='mse of testSet')
plt.subplots_adjust(
#                     left=0.1
#                     , bottom=0.1
#                     ,right=0.2
#                     ,top=None
#                     ,
    wspace=0.3
                    ,hspace=0.2
                   )
print(f"The min testSet error is {min(test_error_list5)} when min_samples_leaf = {x[np.argmin(test_error_list5)]}")
The min testSet error is 0.18247448503812982 when min_samples_leaf = 46
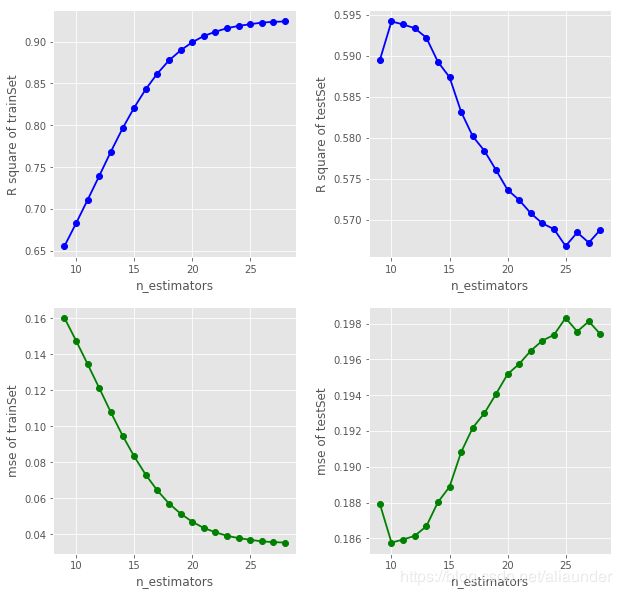
n_estimators>37后,随着其值的增大,测试集误差呈现在一个幅度内上下波动,可以认为 n_estimators 对模型的提升基本已经达到一个极限的状态,我们取test set 的误差最小参数点 n_estimators=46。
6.4.3 随机森林回归最终模型
模型的评分
model_best = RandomForestRegressor(max_depth=10,max_features=7,min_samples_leaf=18,random_state=42,n_estimators=46).fit(Xtrain,ytrain)
print(f'train Score is {model_best.score(Xtrain,ytrain)}')
print(f'test Score is {model_best.score(Xtest,ytest)}')
print(f'train mse is {mean_squared_error(model_best.predict(Xtrain),ytrain)}')
print(f'train mse is {mean_squared_error(model_best.predict(Xtest),ytest)}')
train Score is 0.64125163033465
test Score is 0.6013592840733427
train mse is 0.16674553415397791
train mse is 0.18247448503812982
可以看出,经过调参,模型的性能得到了一定程度的提升。
6.4.4 模型的评估效果
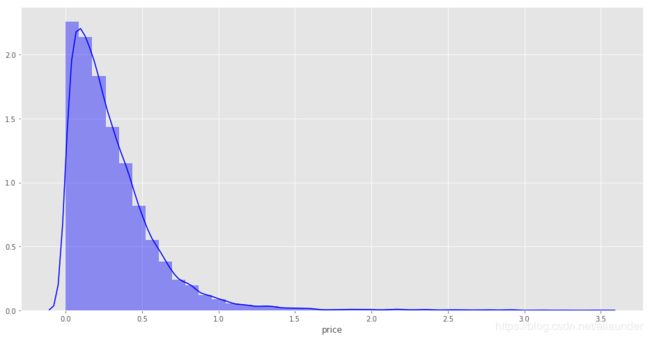
查看真实房价和预测值之间的误差的分布
predict_ytest = model_best.predict(Xtest)
predict_error = np.abs(predict_ytest-ytest)
percent=("%.3f"%(predict_error[predict_error<1].shape[0]/predict_error.shape[0]))
fig,ax=plt.subplots(figsize=(16,8))
import seaborn as sns
sns.distplot(d,ax=ax,color='blue',bins=40)
print(f"Prediction with residual less than 1:{float(percent)*100}%")
Prediction with residual less than 1:97.3%
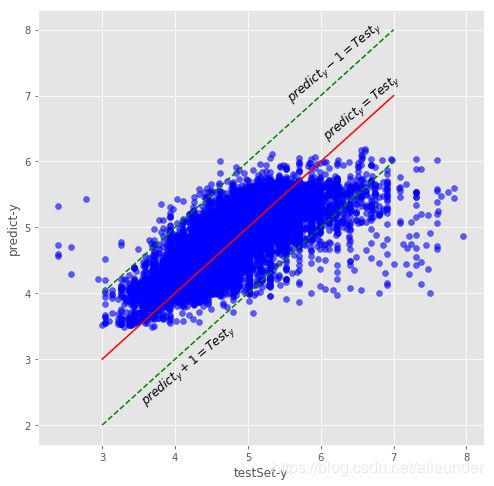
预测房价和真实房价的绝对残差有百分之97在1之内。
fig,ax=plt.subplots(figsize=(8,8))
plt.scatter(x=ytest,y=predict_ytest,alpha=.6,color='blue')
plt.plot(np.arange(3,8),np.arange(3,8),c='red')
plt.plot(np.arange(3,8),np.arange(2,7),c='green',linestyle='--')
plt.plot(np.arange(3,8),np.arange(4,9),c='green',linestyle='--')
ax.set_xlabel(xlabel="testSet-y")
ax.set_ylabel(ylabel="predict-y")
ax.text(x=6,y=7.2,s="$predict_y = Test_y$",rotation=40,fontsize=12)
ax.text(x=5.5,y=8,s="$predict_y -1 = Test_y$",rotation=40,fontsize=12)
ax.text(x=3.5,y=3.4,s="$predict_y + 1 = Test_y$",rotation=40,fontsize=12)
6.5 影响房价的主要特征讨论
importance = model_best.feature_importances_
columns = Xtrain.columns
s = pd.Series(data=importance,index=columns)
s.sort_values(ascending=False)
room_type_Entire home/apt 0.426642
room_type_Private room 0.186533
longitude 0.132072
latitude 0.074411
availability_365 0.047946
neighbourhood_group_Manhattan 0.046079
minimum_nights 0.027121
number_of_reviews 0.013550
calculated_host_listings_count 0.013535
last_review 0.013114
reviews_per_month 0.012218
neighbourhood_group_Brooklyn 0.005753
neighbourhood_group_Queens 0.001028
dtype: float64
结果显示,对房价影响因素最大的,其实是房间的类型,其次是经纬度,然后是可预订的天数及是否在曼哈顿区等等。
7.结论
- 曼哈顿区和布鲁克林区的房源最多
- 房间类型主要以整栋房间和单间为主
- 房价低于500,经度靠近 -73.9 ~ -74.0 区域,维度靠近40.7左右的房源更受游客欢迎
- 对房价影响因素最大的,其实是房间的类型,其次是经纬度,然后是可预订的天数及是否在曼哈顿区等等。

