Matplotlib库之pyplot的使用
Matplotlib库之pyplot的使用
- Pyplot简介
- Pyplot的一些方法
- mac版解决不支持中文
- jupyternotebook可能出现问题
- 线形图plot详解
- 使用fmt格式字符串
- add_subplot绘制子图(分区域)
- 柱形图bar的用法
- 直方图hist用法
- 绘点图scatter用法
- 饼图pie的使用
- 混淆矩阵imshow(表示二维数据的分布情况)
可以查看pyplot官方教程
Pyplot简介
简单的说就是把数据显示成图形用的,比如曲线,棒图,饼图,总之就是数据可视化。
Pyplot的一些方法
| 方法 | 说明 |
|---|---|
| figure() | 创建画布有返回值,重要参数dpi分辨率,figsize画布大小 |
| xlabel(),ylabel() | 通过plt.ylabel(‘纵轴名’)指定轴的名称 |
| plot() | 线形图 |
| axis() | 参数是 [xmin, xmax, ymin, ymax] 列表作为参数来指定了各个轴的视口大小 |
| show() | 展示方法,展示之后会清空内存中图片,因此要先保存图片再show |
| savefig() | 保存图片参数是保存路径和文件名 |
| legend() | 函数主要的作用就是给图加上图例,plt.legend([x,y,z])里面的参数使用的是list的的形式将图表的的名称喂给这和函数。 |
| plt.xticks(bins) | xticks(list) 使用list的值进行 x 轴刻度的标识 |
| title() | 标题 |
| grid() | 设置为true添加网图格plt.grid(True, linestyle=’–’, alpha=0.5) |
mac版解决不支持中文
单个解决方式,以y轴名为例
from matplotlib.font_manager import FontProperties

plt.ylabel('平方值',fontproperties=FontProperties(fname='/System/Library/Fonts/PingFang.ttc'))
当前文件解决方式
# 修改字体
plt.rcParams['font.sans-serif'] = ['Arial Unicode MS']
plt.rcParams['font.size'] = 20  # 修改字体大小
plt.rcParams['axes.unicode_minus'] = False  # 字体是中文时显示负数会有bug,去除一下
jupyternotebook可能出现问题
可能会不展示图,加上以下代码即可
%matplotlib inline
线形图plot详解
def plot(*args, scalex=True, scaley=True, data=None, **kwargs):
- 在plot()中有个格式化字符串fmt可以来指定线的由颜色、标识符和线型三部分,默认是’b-'也就是蓝色实线
- plot的参数:color线颜色,marker标记格式,markerfacecolor标记颜色,markersize标记大小, linestyle线格式
fmt = '[color][marker][line]'
先简单的创建一个试试:
plt.ylabel('平方值',fontproperties=FontProperties(fname='/System/Library/Fonts/PingFang.ttc'))
arr1 = np.arange(0,5)
plt.axis([0,6,0,20])  # 指定了x和y轴最大最小值
plt.plot(arr1, arr1**2, 'r<--')  # fmt格式指定为红色线段,<标记点,虚线格式
plt.show()
- 如果只有一个数组,这个数组默认为y轴内容,x轴自动补齐由0开始
- axis指定了x和y轴的值范围,不然就是默认数组的值范围
- ’r<–‘,r是红色,<指标记点格式,–是指定虚线
使用fmt格式字符串
| 缩写字母 | 代表颜色 | 标记缩写 | 代表的标记格式 |
|---|---|---|---|
| ‘b’ | blue | ‘.’ | 点标记 |
| ‘g’ | green | ‘,’ | 像素标记也就是默认 |
| ‘r’ | red | ‘o’ | 大点标记 |
| ‘c’ | cyan | ’v‘ ‘^’ ‘<’ ‘>’ | 分别是三角形标记的四个方向 |
| ‘m’ | magenta | ‘s’ | 正方形 |
| ‘y’ | yellow | ‘p’ | 五角形 |
| ‘k’ | black | ‘*’ | 五角星 |
| ‘w’ | white | ‘H’ ‘h’ | 两个方向的六边形 |
| - | - | ‘1’ ‘2’ ‘3’ ‘4’ | 三菱线的四个方向 |
| 字符 | 代表的线型 | ‘+’ | +型 |
| ‘-’ | 普通线型 | ‘x’ | x型 |
| ‘–’ | - -虚线 | ‘d’ ‘D’ | d是菱形,D是倒正方形 |
| ‘-.’ | - .虚线 | ‘|’ | 竖线型 |
| ‘:’ | . .虚线 | ‘_’ | 下划线型 |
add_subplot绘制子图(分区域)
第一种方法:生成对象在绘图
# 创建画布,参数dpi分辨率,figsize画布大小
fig = plt.figure()
# 分成多少块,第三个参数是指定第几块
ax1 = fig.add_subplot(2,2,1)  # 2*2,选第一个
ax2 = fig.add_subplot(2,2,2)
ax3 = fig.add_subplot(2,2,3)
ax4 = fig.add_subplot(2,2,4)
# 用这些ax1-4对象的plot方法绘制内容即可
arr2 = list(data['price'])  # data是读取的文件内容,这里没展示
arr3 = list(data['AREA'])
# 面积和价格,第四区域
ax4.plot(arr3,arr2, 'ro')
第二种方法,分割直接写
fig = plt.figure()
arr1 = np.random.randint(10,20,20)
arr2 = np.random.randint(10,20,20)
# 2行3列的第一个区域
fig.add_subplot(2,3,1)  # 不用逗号也一样
plt.plot(arr1)
fig.add_subplot(235)  # 2行3列的第5个区域
plt.plot(arr2)
plt.show()
柱形图bar的用法
常见的参数:
- x,height分别是x轴和y轴的值
- width是宽度
- label是说明,需要显示图例lengend()方法
plt.rcParams['font.sans-serif'] = ['Arial Unicode MS']  # 中文
x = np.arange(5)
y1 = np.random.randint(10,100,5)
y2 = np.random.randint(10,100,5)
fig = plt.figure()
# fig.add_subplot(1,2,1)
# 指定x,y的值
plt.bar(x, y1,width=0.4,label='第一组')
# fig.add_subplot(1,2,2)
plt.bar(x+0.4,y2,width=0.4,label='第二组')
# 显示图例
plt.legend()
plt.show()
直方图hist用法
几个常见的参数
- x,这个参数是指定每个bin(箱子)分布的数据,对应x轴
- bins这个参数指定bin(箱子)的个数,也就是总共有几条条状图
- density这个参数指定密度,也就是每个条状图的占比例比,默认为1
- alpha透明度
arr1 = [131,  98, 125, 131, 124, 139, 131, 117, 128, 108, 135, 138, 131, 102, 107, 114, 119, 128, 121, 142, 127, 130, 124, 101, 110, 116, 117, 110, 128, 128, 115,  99, 136, 126, 134,]

plt.rcParams['font.sans-serif'] = ['Arial Unicode MS']
plt.rcParams['font.size'] = 20  # 修改字体大小
plt.rcParams['axes.unicode_minus'] = False  # 字体是中文时显示负数会有bug,去除一下
# 展示刻度
plt.xticks(range(min(arr1), max(arr1))[::4])
# 个数
bins = (max(arr1) - min(arr1)) // 4
print(bins)
plt.hist(arr1, bins=bins, density=1, alpha=0.8)
plt.grid(True, linestyle="--", alpha=0.5)
plt.ylabel('数量')
plt.title('直方图')
plt.show()
绘点图scatter用法
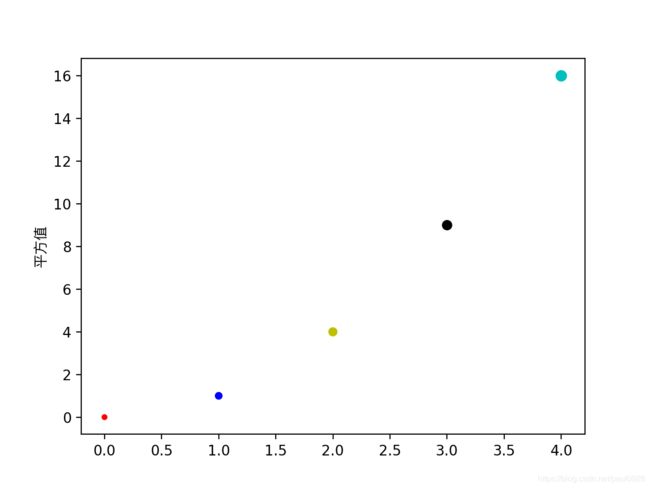
- scatter(x, y, 点的大小, 颜色,标记),默认顺序
- 参数c指定颜色可以是字符缩写也可以是数组会自动对应,s指定大小
两个案例:
plt.scatter(arr1,arr1**2,[10,20,30,40,50],['r','b','y','k','c'])
- Matplotlib 允许用户提供带有关键字的数据对象作为参数,一旦提供了带有关键字的数据,就能够直接使用关键字来代替这些变量去生成图形。
data = {'a': np.arange(50),
        'c': np.random.randint(0, 50, 50),
        'd': np.random.randn(50)}
data['b'] = data['a'] + 10 * np.random.randn(50)
data['d'] = np.abs(data['d']) * 100
# 指定颜色和大小,数据
plt.scatter('a', 'b', c='c', s='d', data=data)
plt.show()
饼图pie的使用
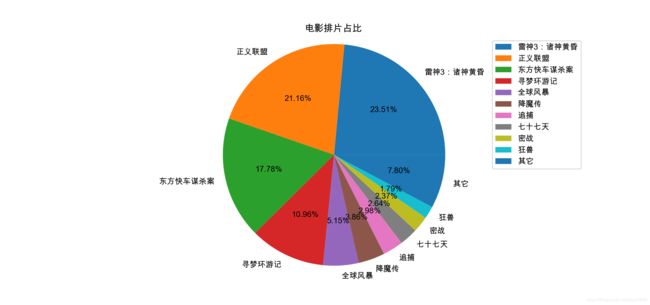
- x:数量,自动算百分比
- labels:每部分名称,长度和x要一样
- explode:1就是把饼图拿出来,[1,0,…]列表长度要和x一样
- autopct:占比显示指定%1.2f%%
- colors:每部分颜色,列表,可以自定[‘b’,‘r’,‘g’,‘y’,‘c’,‘m’,‘y’,‘c’,‘g’,‘y’]也可以自动填色
- shadow等于True加阴影
import matplotlib.pyplot as plt
plt.rcParams['font.sans-serif'] = ['Arial Unicode MS']
# 准备数据
movie_name = ['雷神3:诸神黄昏','正义联盟','东方快车谋杀案','寻梦环游记','全球风暴','降魔传','追捕','七十七天','密战','狂兽','其它']
place_count = [60605,54546,45819,28243,13270,9945,7679,6799,6101,4621,20105]
# 展示
plt.pie(place_count, labels=movie_name,autopct="%1.2f%%")
# 显示图例
plt.legend()
# 添加标题
plt.title("电影排片占比")
# 规定为正圆
plt.axis('equal')
plt.show()
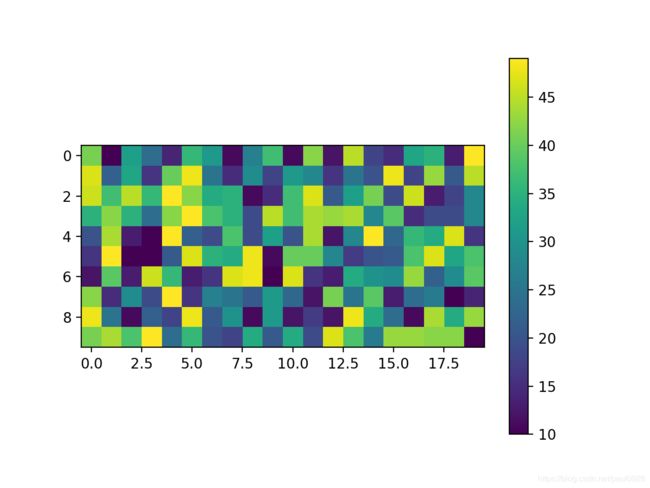
混淆矩阵imshow(表示二维数据的分布情况)
arr1 = np.random.randint(10,50,(10,20))
plt.imshow(arr1)  # 混淆矩阵 cmap=plt.cm.Blues颜色风格
plt.colorbar()  # 颜色和值对应图
plt.show()


