prometheus 学习笔记(一)
概述
prometheus是一种时间序列的数据库,它适合应用于监控以及告警,但是不合适%100的准确计费,因为采集的数据不一定很准确,主要是监控以及搜集内存、CPU、硬盘的数据
prometheus 的特点
和其他监控系统相比,Prometheus的特点包括:
- 多维数据模型(时序列数据由metric名和一组key/value组成)
- 在多维度上灵活的查询语言(PromQl)
- 不依赖分布式存储,单主节点工作.
- 通过基于HTTP的pull方式采集时序数据
- 可以通过中间网关进行时序列数据推送(pushing)
- 目标服务器可以通过发现服务或者静态配置实现
- 多种可视化和仪表盘支持
prometheus 相关组件
Prometheus生态系统由多个组件组成,其中许多是可选的:
- Prometheus 主服务,用来抓取和存储时序数据
- client library 用来构造应用或 exporter 代码 (go,java,python,ruby)
- push 网关可用来支持短连接任务
可视化的dashboard (两种选择,promdash 和 grafana.目前主流选择是 grafana.)
一些特殊需求的数据出口(用于HAProxy, StatsD, Graphite等服务)
实验性的报警管理端(alartmanager,单独进行报警汇总,分发,屏蔽等 )
promethues 的各个组件基本都是用 golang 编写,对编译和部署十分友好.并且没有特殊依赖.基本都是独立工作.架构

安装prometheus
下载 Prometheus
下载Prometheus,根据你的系统下载相关的二进制
wget https://github.com/prometheus/prometheus/releases/download/v2.2.1/prometheus-2.2.1.linux-amd64.tar.gz解压prometheus
tar xvfz prometheus-*.tar.gz
cd prometheus-*
查看命令行
./prometheus --help
usage: prometheus [<flags>]

The Prometheus monitoring server

. . .
配置prometheus
prometheus默认使用的配置文件是prometheus.yml
为了描述简单,去掉了很多相关的配置选项,如下
global:
  scrape_interval:     15s
  evaluation_interval: 15s

rule_files:
  # - "first.rules"
  # - "second.rules"

scrape_configs:
  - job_name: prometheus
    static_configs:
      - targets: ['localhost:9090']
示例配置文件中有三个配置块:
global:
  scrape_interval:     15s //全局配置,多久搜集一次
  evaluation_interval: 15s //全局配置,多久搜集一次

rule_files: //规则文件
  # - "first.rules"
  # - "second.rules"

scrape_configs: //搜集的配置
  - job_name: prometheus //监控的服务名称
    static_configs:
      - targets: ['localhost:9090'] //监控入口
更详细的配置说明请参考configuration
启动prometheus服务
./prometheus --config.file=prometheus.ymlhttp_requests_total 表示已发出的请求数,查看发出的请求数

查看请求成功数
http_requests_total{code="200"}
count(http_requests_total)
关于表达式的信息请参考expression language documentation
输入以下表达式来绘制在自刮自动Prometheus中发生的每秒HTTP请求率:
rate(http_requests_total[1m])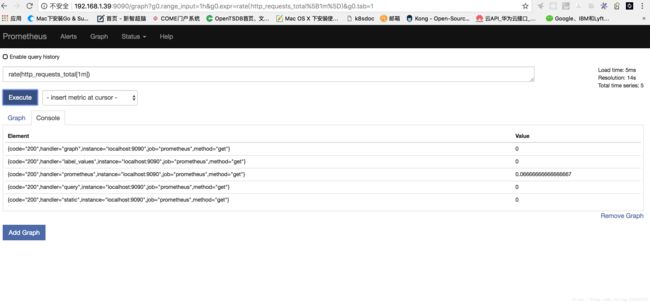
安装Node Exporter
下载node_exporter
解压
tar xvfz node_exporter-*.tar.gz
cd node_exporter-*
启动
./node_exporter访问http://localhost:9100/metrics.
配置节点监控,例如
- job_name: node
  static_configs:
    - targets: ['localhost:9100']
这个是另一种监控方法,详细介绍请前往官网installing-the-node-exporter
参考
overview
Prometheus 初探
first_steps