Home buyers have more choices and they are taking their time before making up their minds. Now looking at the entire East Bay, the trend towards more home for sale that started in January and continued in February. Now, I am not just talking about the season increases, there were a lot of homes for sale in February comparing this time last year.
EAST BAY MARKET BIG PICTURE
- Supply: The inventory is up 42% compared with February 2018. There are more than 2000 home listed for sale compared with 1500 homes for sale February last year.
- Demand: Home sales were only up 3%
- Home are on the market is much longer than last year. Days-on-market: 34 days (increased from 27 days since last February 2018)
With this cooler markets, you would expect the price to be dropping. That's where things get complicated and we need to look at specific communities. Let's do that right now along I-880 corridor. (See Image 1)
There are more homes for sales just about everywhere. (See Image 2)
However, the prices are mixed. (See Image 3)
On the sales side, there is a bit of bump in Fremont up to 57 homes sold, but Hayward is down 15%, Oakland is basic flat, San Leandro is the same, Union City is down almost 20%. (See Image 4)
THE WEST CONTRA COSTA COUNTY MARKET
The West Contra Costa County market is the same and different. Inventory is up. El Cerrito doubled with 10 for sale and El Sobrante, Hercules, Pinole, and Richmond all have more homes in the market. The only exception is San Pablo which dropped to 15 for sale. (See Image 5)
The most supplier had minimum impact on prices. El Cerrito is up a bit, EL Sobrante dropped to $473,000. Hercules and Pinole are also flat and Richmond down to $515,000. (See Image 6)
Looking at sales, it is mixed. El Sobrante and Hercules are both ways down. With sales in Pinole, Richmond and San Pablo, basically unchanged. (See Image 7)
CENTRAL CONTRA COSTA COUNTY MARKET
It was a similar situation in Central Contra Costa County. There are more homes for sale almost everywhere. (See Image 8)
The prices are stabilized in Central Contra Costa County. Martinez is down to $600,000 and there are no big changes in Pleasant Hill and Walnut Creek. (See Image 9)
Sales were mixed. (Image 10) Clayton and Concord are basically unchanged and Martinez is down to 16 sold and Pleasant Hill is about the same and Walnut Creek dropped to 24 home sold. (See Image 10)
LAMORINDA MARKET
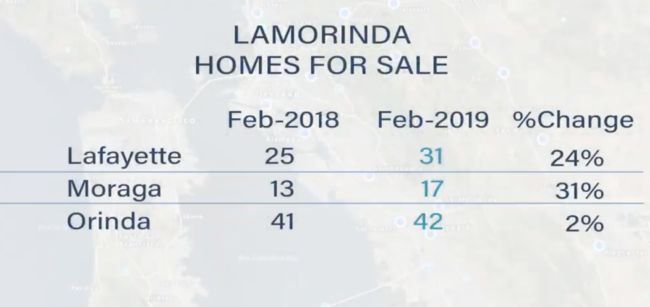
Lamorinda is more of the same, sort of. There are more homes in the market. (See Image 11)
However, the prices have wide swings. Lafayette has 31% increases to $1,705,00. (See Image 12)
Looking at the buyer's response, Lafayette and Moraga have no change, but Orinda has a big jump with a 13 sold. (See Image 13)
TRI-VALLEY MARKET
One example of a Supply and Demand relationship, check the TRI-Valley market. There were more homes for sale everywhere. (See Image 14)
There were lower prices compared with last February. Alamo has a big drop to $1,608,000. (See Image 15)
Buyers definitely responded. Most of the sales almost doubled. (See Image 16)
DELTA MARKET
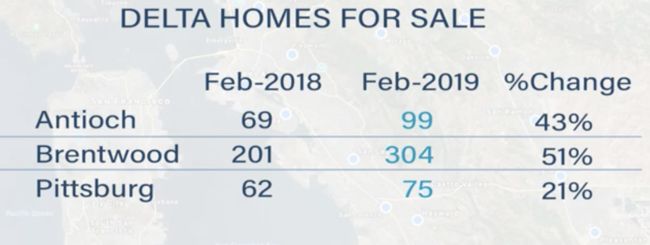
The Delta is another example of how macroeconomics works. We will start with the SUPPLY. (See image 17) It was up everywhere.
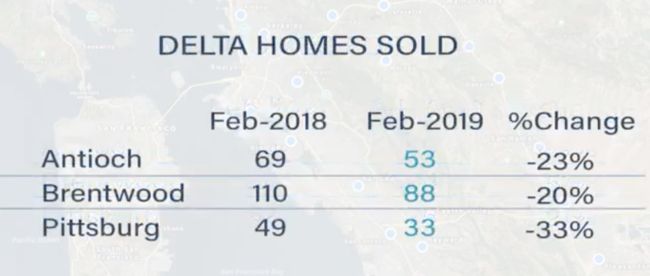
And now, DEMAND. Sales were off. (See Image 18)
Why they disconnected? Prices. (See Image 19)
SUMMARY
Is the marketing changing? More inventory and prices coming down? Says YES!
We will see you next month.
David Stark - Public Affairs Director of Bay East Association of Realtor®
Reference
David Stark. [March 2019 East Bay Real Estate Weather Report]. (2019, March 25). March 2019 East Bay Real Estate Weather Report. Retrieved from https://www.youtube.com/watch?v=77G4eeNcZJ8&t=1s


