matplotlib绘图基础--2
紧接着上一篇
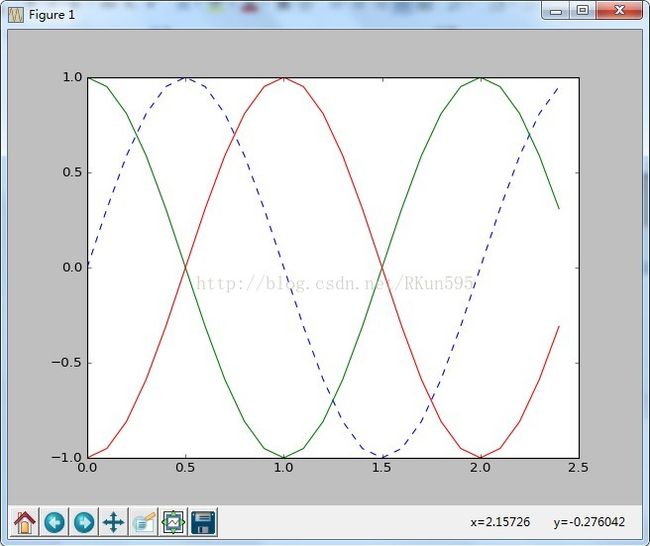
用三种线条表示三种正弦趋势
In [6]: t = np.arange(0,2.5,0.1)
In [7]: y1 = map(math.sin,math.pi*t)
In [8]: y2 =map(math.sin,math.pi*t+math.pi/2)
In [9]: y3 =map(math.sin,math.pi*t-math.pi/2)
In [10]: plt.plot(t,y1,'b--',t,y2,'g',t,y3,'r--')
使用kwargs
组成图表的各个对象有很多用以描述它们特点的属性。这些属性均有默认值,但可以用关键字参数(keyword kwargs)设置
定义
matplotlib.pyplot.plot(*args,**kwargs)
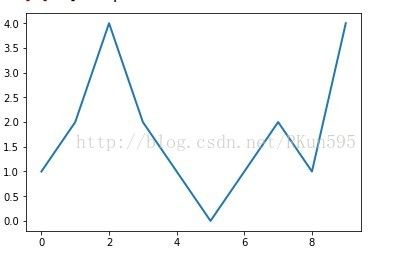
设置linewidth关键字参数,可以改变线条的粗细
plt.plot([1,2,4,2,1,0,1,2,1,4],linewidth=2)
处理多个figure和Axes对象
使用subplot函数将图形分为不同的区域
类似In[10]的这种写法,是在输入完一行以后按”Ctrl+ Enter”来实现的换行,这样可以使这四行代码一同执行。

此处将图形分为了上下两部分来绘制,我们还可以把图形分为左右两个子图。subplot()函数传递进去的参数应分别为121和122。
t = np.arange(0.,1.,0.05)
y1 = np.sin(2*np.pi*t)
y2 = np.cos(2*np.pi*t)
plt.subplot(121)
plt.plot(t,y1,'b-.')
plt.subplot(122)
plt.plot(t,y2,'r--')

为图表添加更多元素
添加文本
axis函数用来制定坐标轴的取值范围
title函数用来设置图像标题
xlabel函数用来设置x轴的轴标签
ylabel函数用来设置y轴的轴标签
In[21]:plt.axis([0,5,0,20])
...: plt.title("This is title")
...: plt.xlabel("This is x label")
...: plt.ylabel("This is y lable")
...:plt.plot([1,2,3,4],[1,4,9,16],'ro