Python3绘制分形图像
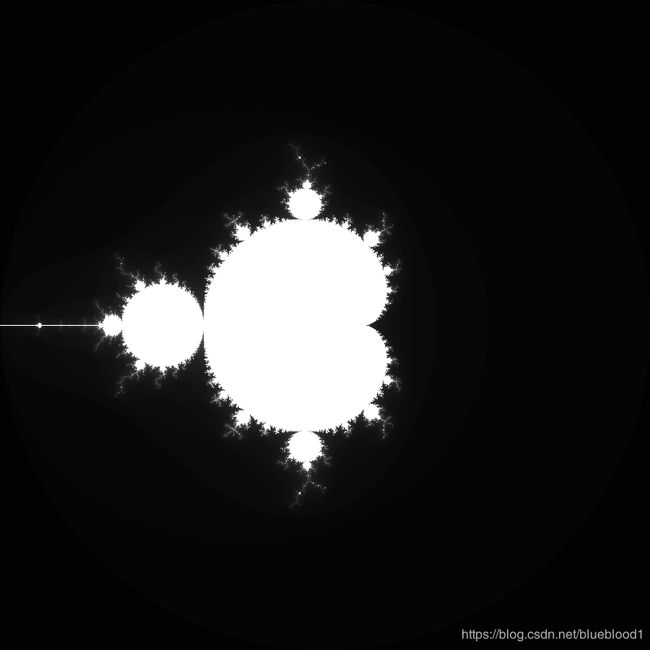
如何使用Python3计算、绘制、保存分形图像呢?下面以Mandelbrot分形图像为例介绍。
一、计算分形图像点集
Mandelbrot集由一个复变函数f(z) = z*z + c生成,其中c为当前坐标点,z从0开始迭代。
为了使绘制出的分形图像更美观,我们使用逃逸时间算法计算出带有逃逸点的Mandelbrot集,代码如下:
def get_mandelbrot_set_with_escape_points(width, height):
    """
    获得带有逃逸点的Mandelbrot集
    :param width:
    :param height:
    :return: Mandelbrot集
    """
    screen_points_with_escape_time = []  # 三维,第三维为逃逸时间
    for i in range(width):
        for j in range(height):
            fx_x, fx_y = screen_coordinate_to_fx_coordinate(i, j, width, height, fx_short_axis_length=4)

            tmp = 0
            escape_time = -1  # 逃逸时间
            for it in range(100):  # 迭代100次
                if abs(tmp) > 2:
                    escape_time = it
                    break
                tmp = tmp * tmp + complex(fx_x, fx_y)

            screen_points_with_escape_time.append((i, j, escape_time))

    print('Got {} Mandelbrot points and escaped points in area {} * {}.'.format(len(screen_points_with_escape_time), width, height))
    return screen_points_with_escape_time


def screen_coordinate_to_fx_coordinate(screen_x, screen_y, screen_width, screen_height, fx_short_axis_length=4):
    """
    屏幕坐标转换为分形坐标
    :param screen_x:
    :param screen_y:
    :param screen_width:
    :param screen_height:
    :param fx_short_axis_length: 分形坐标系的短轴长度,长轴长度根据屏幕坐标系比例计算
    :return: 分形坐标系下的坐标
    """
    if screen_width <= 0 or screen_height <= 0 or fx_short_axis_length <= 0:
        print('Invalid screen_coordinate_to_fx_coordinate params.')
        return 0, 0
    if screen_x < 0 or screen_x >= screen_width or screen_y < 0 or screen_y >= screen_height:
        print('Invalid screen coordinate: {}', (screen_x, screen_y))
        return 0, 0

    if screen_width >= screen_height:
        fx_width, fx_height = fx_short_axis_length * screen_width / screen_height, fx_short_axis_length
    else:
        fx_width, fx_height = fx_short_axis_length, fx_short_axis_length * screen_height / screen_width

    fx_x = screen_x * fx_width / screen_width - fx_width / 2
    fx_y = -(screen_y * fx_height / screen_height - fx_height / 2)

    return fx_x, fx_y
需注意以下几点:
- 分形坐标系的范围为-2 ~ 2,所以需要对屏幕坐标系下的点进行坐标变换;
- 逃逸时间算法的思想是将迭代时点超出某固定区域(一般选半径为2的圆)时的迭代次数作为逃逸时间。
二、绘制分形图像
得到带有逃逸点的分析图像点集后就可以绘制分形图像了,根据逃逸时间来显示不同的颜色,代码如下:
def draw_multi_color_fx_image(screen_points_with_escape_time, width, height, begin_color, end_color, image_show_time=0):
    """
    绘制渐变色分形图像
    :param screen_points_with_escape_time: 分形点集,屏幕坐标系,第三维为逃逸时间
    :param width:
    :param height:
    :param begin_color: 开始颜色,RGB
    :param end_color: 结束颜色,RGB
    :param image_show_time: 图像显示时间,毫秒,0表示无限
    :return:
    """
    if len(screen_points_with_escape_time) == 0:
        print('No points to draw.')
        return

    # 获取点集中的最大逃逸时间
    max_escape_time = -1
    for i, j, escape_time in screen_points_with_escape_time:
        if escape_time > max_escape_time:
            max_escape_time = escape_time
    color_count = max_escape_time + 2  # 渐变色数量,逃逸时间从-1开始
    colors = get_multi_colors_by_hsl(begin_color, end_color, color_count)
    escape_colors = {}  # 逃逸时间:颜色
    for i in range(color_count - 1):
        escape_colors[i] = [colors[i][2], colors[i][1], colors[i][0]]  # RGB -> BGR
    escape_colors[-1] = [end_color[2], end_color[1], end_color[0]]  # RGB -> BGR

    # 填充图像矩阵
    image_matrix_list = [[[] for col in range(width)] for row in range(height)]
    for i, j, escape_time in screen_points_with_escape_time:
        image_matrix_list[j][i] = escape_colors[escape_time]  # 列索引在前
    image_matrix = np.array(image_matrix_list, dtype=np.uint8)

    # 绘图
    cv.namedWindow('Fractal image')
    cv.moveWindow('Fractal image', 200, 50)
    cv.imshow('Fractal image', image_matrix)
    cv.waitKey(image_show_time)
    # cv.destroyAllWindows()

    return image_matrix
计算渐变色的算法请参考上一篇博文:RGB渐变色与HSL渐变色
三、其它分形图像
谢尔宾斯基地毯
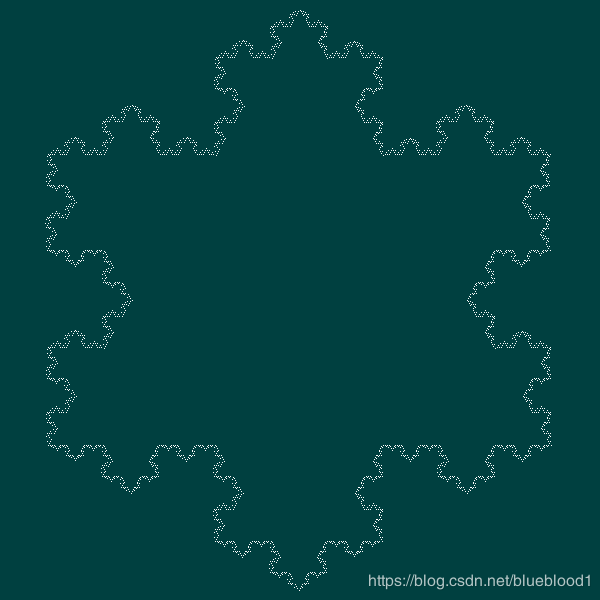
Koch雪花
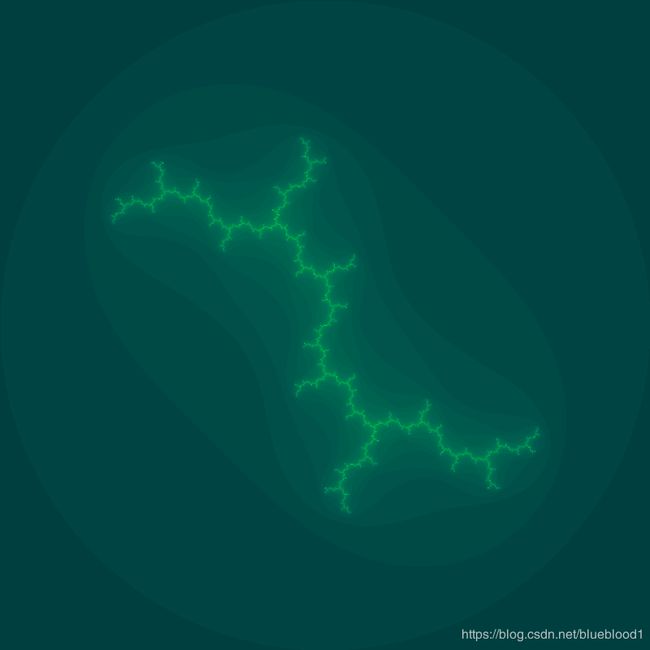
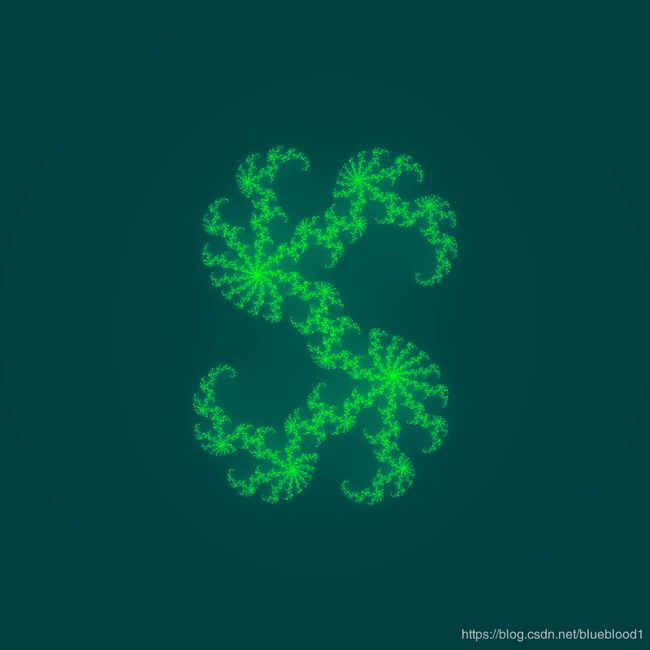
一些Julia分形图像
完整代码见Github项目:d0fractal


