散点图scatter
import numpy as np
import matplotlib.pyplot as plt
#data = np.loadtxt('/home/bymaymay/data1.txt', delimiter=',') #data1.txt中数据格式,例:34,78,0
data = np.array([[3,7,0],[3,4,0],[6,8,1],[7,7,1]])
x = data[:,0:2] #所有行,第0和1列
y = data[:,2] #所有行,第2列
pos = np.where(y==1) #记录标号y为1的行的行号,结果pos=array([2,3])
neg = np.where(y==0) #记录标号y为0的行的行号,结果neg=array([0,1])

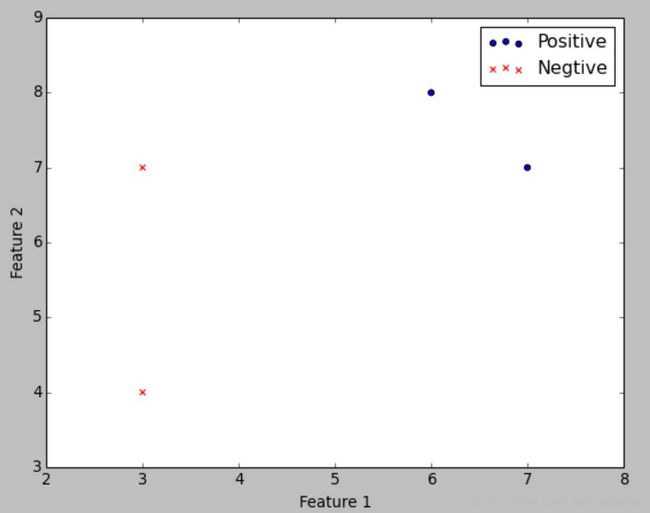
plt.scatter(x[pos,0], x[pos,1], marker='o', c='b')
plt.scatter(x[neg,0], x[neg, 1], marker='x', c='r')
plt.xlabel('Feature 1')
plt.ylabel('Feature 2')
label = ["Positive", "Negtive"]
plt.legend(label)
plt.show() #Ctrl+D退出Python命令行
运行结果为:

画布里多个图
import matplotlib.pyplot as plt
fig = plt.figure() #定义figure
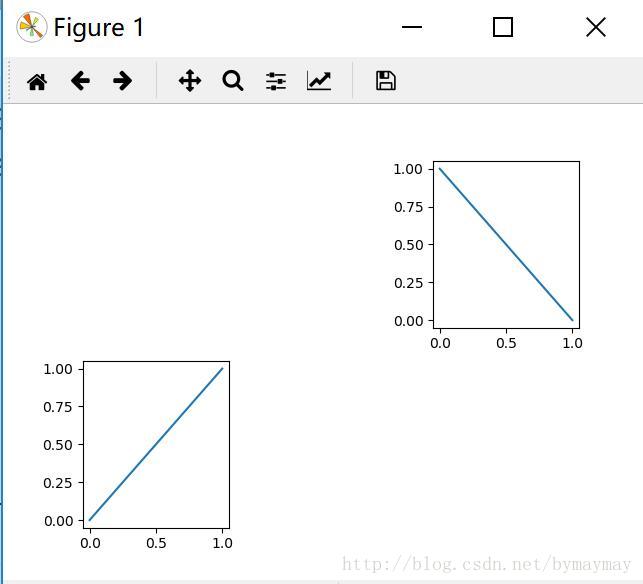
ax = fig.add_subplot(234) #将画布分割成2行3列,图像画在从左到右从上到下的第4块
ax.plot([0,1])
ax = fig.add_subplot(2,3,3) #将画布分割成2行3列,图像画在从左到右从上到下的第3块
ax.plot([1,0])
plt.show()#显示图片
运行结果为:


