sigmod函数tanh函数ReLU函数
**一. sigmod(x)函数**relre
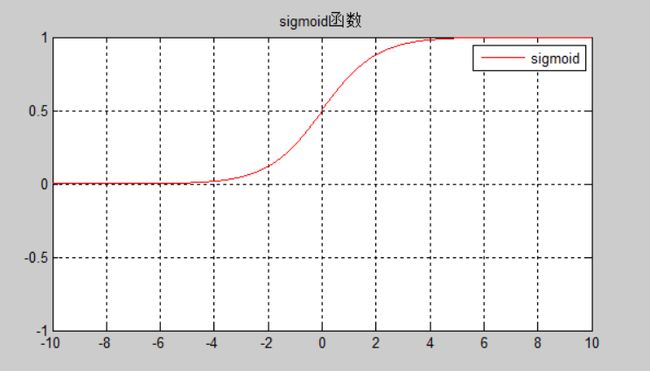
sigmod函数的数学公式为:
Θ(x)=11+e−x Θ ( x ) = 1 1 + e − x
函数取值范围(0,1),函数图像下图所示:
二. tanh(x) 函数
tanh(x)函数的数学公式为:
tanh(x)=sinh(x)cosh(x) t a n h ( x ) = s i n h ( x ) c o s h ( x )
函数取值范围(-1,1),函数图像下图所示:
其中sinh(x)数学公式为:
sinh(x)=ex−e−x2 s i n h ( x ) = e x − e − x 2
其中cosh(x)数学公式为:
cosh(x)=ex+e−x2 c o s h ( x ) = e x + e − x 2
三. ReLU(校正线性单元:Rectified Linear Unit)激活函数
ReLU函数公式为
max(0,x)={0,x,if x ≤ 0if x > 0 m a x ( 0 , x ) = { 0 , if x ≤ 0 x , if x > 0
四. Matlab画函数图像代码
function [ output_args ] = sigmod_tanh( input_args )
%JOINT Summary of this function goes here
%   Detailed explanation goes here
t1 = linspace(-10,10,500);
t2 = linspace(-10,10,500);
t3 = linspace(-10,10,500);
%    zhx = -12.1*sin(2*pi*(time-0.25))-abs(12.1*sin(2*pi*(time-0.25)));
%    zhx = 0;

a = 1;
c = 0;
% sigmod & tanh
sigmod = sigmf(t1,[a c])
tan_h = tanh(t2);
max_f = max(0,t3);

%激活函数
subplot(2,2,1);
plot(t1, sigmod,'r-');
legend('sigmoid')
title('sigmoid函数')
axis([-10, 10, -1, 1])   % 坐标轴的显示范围
set(gca, 'XGrid','on');  % X轴的网格
set(gca, 'YGrid','on');  % Y轴的网格

subplot(2,2,2);
plot(t2,tan_h,'b-');
legend('tanh')
title('tanh函数')
axis([-10, 10, -1, 1])   % 坐标轴的显示范围
set(gca, 'XGrid','on');  % X轴的网格
set(gca, 'YGrid','on');  % Y轴的网格

subplot(2,2,3);
plot(t3,max_f,'c-');
legend('max(0,x)')
title('max(0,x)函数')
axis([-10, 10, -10, 10])   % 坐标轴的显示范围
set(gca, 'XGrid','on');  % X轴的网格
set(gca, 'YGrid','on');  % Y轴的网格
end
参考文献
[1] https://zhuanlan.zhihu.com/p/21462488?refer=intelligentunit 函数说明
[2] http://meta.math.stackexchange.com/questions/5020/mathjax-basic-tutorial-and-quick-reference 公式书写
[3] https://en.wikipedia.org/wiki/Modern_Greek 阿拉伯字母
[4] http://baike.baidu.com/linkurl=7PMqoeME8neZbhn6hsV0YPZWz1Acv2kr41WpFfTJmaqqvmjX43SkvYcrzuwN08OQHNGEFRzHiBj164Lp9JWwma tanh(x)说明

