Python:层次聚类分析
层次分析属于聚类分析的一种,Scipy有这方面的封装包。
linkage函数从字面意思是链接,层次分析就是不断链接的过程,最终从n条数据,经过不断链接,最终聚合成一类,算法就此停止。
dendrogram是用来绘制树形图的函数。
from scipy.cluster.hierarchy import linkage, dendrogram
import matplotlib.pyplot as plt
import pandas as pd
seeds_df = pd.read_csv('seeds-less-rows.csv') #网络上可以下载到
seeds_df.head()
#移除文本数据列
varieties = list(seeds_df.pop('grain_variety'))
varieties以下是运行结果:
['Kama wheat',
 'Kama wheat',
 'Kama wheat',
 'Rosa wheat',
 'Rosa wheat',
 'Rosa wheat',
 'Rosa wheat',
 'Rosa wheat',
 'Canadian wheat',
 'Canadian wheat',
 'Canadian wheat',
 'Canadian wheat',
 'Canadian wheat',
 'Canadian wheat']
使用linkage函数对samples进行层次聚类
linkage的参数列表如下所述:
X = linkage(features, method='single', metric='euclidean')其中,第一个参数是特征矩阵,第二个参数表示计算类别间距离的方法,有single(最近邻)、average(平均距离)以及complete(最远邻)。
该方法的返回为(m-1)*4的矩阵。
我们运行mergings = linkage(samples)得到以下返回:
array([[ 3.        ,  6.        ,  0.37233454,  2.        ],
       [11.        , 12.        ,  0.77366442,  2.        ],
       [10.        , 15.        ,  0.89804259,  3.        ],
       [ 5.        , 14.        ,  0.90978998,  3.        ],
       [13.        , 16.        ,  1.02732924,  4.        ],
       [ 0.        ,  2.        ,  1.18832161,  2.        ],
       [ 4.        , 17.        ,  1.28425969,  4.        ],
       [ 7.        , 20.        ,  1.62187345,  5.        ],
       [ 1.        , 19.        ,  2.02587613,  3.        ],
       [ 9.        , 18.        ,  2.13385537,  5.        ],
       [ 8.        , 23.        ,  2.323123  ,  6.        ],
       [22.        , 24.        ,  2.87625877,  9.        ],
       [21.        , 25.        ,  3.12231564, 14.        ]])
其中,第一列和第二列代表类标签,包含叶子和枝子。
第三列代表叶叶(或叶枝,枝枝)之间的距离
第四列代表该层次类中含有的样本数(记录数)
X = linkage(features, method='single', metric='euclidean')
#method是指计算类间距离的方法,比较常用的有3种:
#single:最近邻,把类与类间距离最近的作为类间距
#average:平均距离,类与类间所有pairs距离的平均
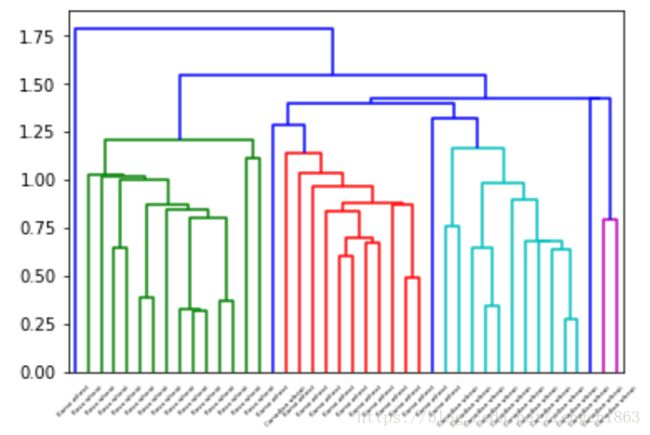
#complete:最远邻,把类与类间距离最远的作为类间距 通过dendrogram(mergings, labels=varieties, leaf_rotation=45, leaf_font_size=10)可以得到层次聚类图:

层次聚类相比Keans的好处就是它不用事先指定聚类的个数,但是随之而来的是计算复杂度的增加。
