【python图像处理】彩色映射
在图像处理,尤其是医学图像处理的过程中,我们经常会遇到将灰度图映射成彩色图的情形,如将灰度图根据灰度的高低映射成彩虹色图。这个过程我们通常将之称为伪彩映射,伪彩映射的关键在于找到合适的彩色映射表,即colormap,也称color bar。
前段时间做了一个涉及到伪彩映射的项目,在找colormap的过程中,我发现Python的matplotlib模块中内嵌了一大批常用的colormaps,使用如下代码:
import numpy as np
import matplotlib.pyplot as plt

# Have colormaps separated into categories:
# http://matplotlib.org/examples/color/colormaps_reference.html

cmaps = [('Perceptually Uniform Sequential',
                            ['viridis', 'inferno', 'plasma', 'magma']),
         ('Sequential',     ['Blues', 'BuGn', 'BuPu',
                             'GnBu', 'Greens', 'Greys', 'Oranges', 'OrRd',
                             'PuBu', 'PuBuGn', 'PuRd', 'Purples', 'RdPu',
                             'Reds', 'YlGn', 'YlGnBu', 'YlOrBr', 'YlOrRd']),
         ('Sequential (2)', ['afmhot', 'autumn', 'bone', 'cool',
                             'copper', 'gist_heat', 'gray', 'hot',
                             'pink', 'spring', 'summer', 'winter']),
         ('Diverging',      ['BrBG', 'bwr', 'coolwarm', 'PiYG', 'PRGn', 'PuOr',
                             'RdBu', 'RdGy', 'RdYlBu', 'RdYlGn', 'Spectral',
                             'seismic']),
         ('Qualitative',    ['Accent', 'Dark2', 'Paired', 'Pastel1',
                             'Pastel2', 'Set1', 'Set2', 'Set3']),
         ('Miscellaneous',  ['gist_earth', 'terrain', 'ocean', 'gist_stern',
                             'brg', 'CMRmap', 'cubehelix',
                             'gnuplot', 'gnuplot2', 'gist_ncar',
                             'nipy_spectral', 'jet', 'rainbow',
                             'gist_rainbow', 'hsv', 'flag', 'prism'])]


nrows = max(len(cmap_list) for cmap_category, cmap_list in cmaps)
gradient = np.linspace(0, 1, 256)
gradient = np.vstack((gradient, gradient))


def plot_color_gradients(cmap_category, cmap_list):
    fig, axes = plt.subplots(nrows=nrows)
    fig.subplots_adjust(top=0.95, bottom=0.01, left=0.2, right=0.99)
    axes[0].set_title(cmap_category + ' colormaps', fontsize=14)

    for ax, name in zip(axes, cmap_list):
        ax.imshow(gradient, aspect='auto', cmap=plt.get_cmap(name))
        pos = list(ax.get_position().bounds)
        x_text = pos[0] - 0.01
        y_text = pos[1] + pos[3]/2.
        fig.text(x_text, y_text, name, va='center', ha='right', fontsize=10)

    # Turn off *all* ticks & spines, not just the ones with colormaps.
    for ax in axes:
        ax.set_axis_off()

for cmap_category, cmap_list in cmaps:
    plot_color_gradients(cmap_category, cmap_list)

plt.show()我们可以得到matplotlib中内嵌的colormaps(应该是全部,但不是很确定):


如何获取colormap
如此众多的colormaps,应该能满足我们大部分的需求。当然,我们更关心的是如何将这些colormap中具体的数值导出来,这样使用起来会更加的灵活方便。当然,只要你想做到,是没有什么能够阻拦你的。
以获取最常用的jet映射表为例,我们可以使用如下代码分别获取整型和浮点型的jet map,并将其保存在txt文件中:
from matplotlib import cm

def get_jet():

    colormap_int = np.zeros((256, 3), np.uint8)
    colormap_float = np.zeros((256, 3), np.float)

    for i in range(0, 256, 1):
       colormap_float[i, 0] = cm.jet(i)[0]
       colormap_float[i, 1] = cm.jet(i)[1]
       colormap_float[i, 2] = cm.jet(i)[2]

       colormap_int[i, 0] = np.int_(np.round(cm.jet(i)[0] * 255.0))
       colormap_int[i, 1] = np.int_(np.round(cm.jet(i)[1] * 255.0))
       colormap_int[i, 2] = np.int_(np.round(cm.jet(i)[2] * 255.0))

    np.savetxt("jet_float.txt", colormap_float, fmt = "%f", delimiter = ' ', newline = '\n')
    np.savetxt("jet_int.txt", colormap_int, fmt = "%d", delimiter = ' ', newline = '\n')

    print colormap_int

    return
获取其他种类的colormap与之类似:
def get_spectral():

    colormap_int = np.zeros((256, 3), np.uint8)
    colormap_float = np.zeros((256, 3), np.float)

    for i in range(0, 256, 1):
       colormap_float[i, 0] = cm.spectral(i)[0]
       colormap_float[i, 1] = cm.spectral(i)[1]
       colormap_float[i, 2] = cm.spectral(i)[2]

       colormap_int[i, 0] = np.int_(np.round(cm.spectral(i)[0] * 255.0))
       colormap_int[i, 1] = np.int_(np.round(cm.spectral(i)[1] * 255.0))
       colormap_int[i, 2] = np.int_(np.round(cm.spectral(i)[2] * 255.0))

    np.savetxt("spectral_float.txt", colormap_float, fmt = "%f", delimiter = ' ', newline = '\n')
    np.savetxt("spectral_int.txt", colormap_int, fmt = "%d", delimiter = ' ', newline = '\n')

    print colormap_int

    return
当然,我们也可以根据需要对获得的colormap中的值进行调整。当我们获得心仪的colormap之后,伪彩映射就成了水到渠成的事情了。
下面是用Python写的伪彩映射的代码:
def gray2color(gray_array, color_map):

    rows, cols = gray_array.shape
    color_array = np.zeros((rows, cols, 3), np.uint8)

    for i in range(0, rows):
        for j in range(0, cols):
            color_array[i, j] = color_map[gray_array[i, j]]

    #color_image = Image.fromarray(color_array)

    return color_array
def test_gray2color():
gray_image = Image.open('Image.png').convert("L")
gray_array = np.array(gray_image)
figure()
subplot(211)
plt.imshow(gray_array, cmap = 'gray')
jet_map = np.loadtxt('E:\\Development\\Thermal\\ColorMaps\\jet_int.txt', dtype = np.int)
color_jet = gray2color(gray_array, jet_map)
subplot(212)
plt.imshow(color_jet)
show()
return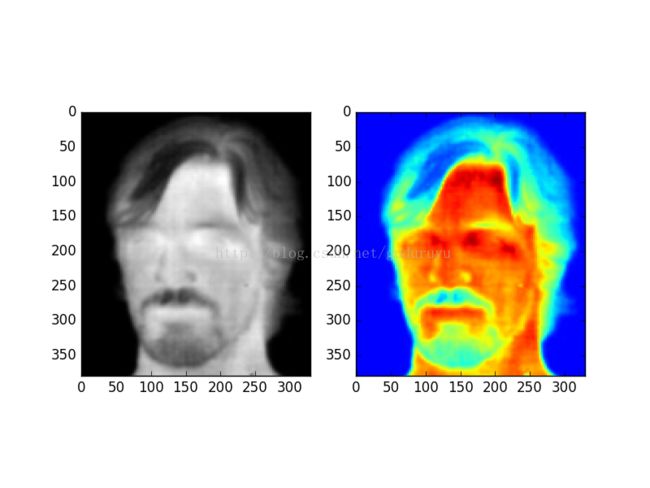
这一篇先就介绍到这里,后面一篇将向大伙介绍如何使用python生成自定义的colormap。