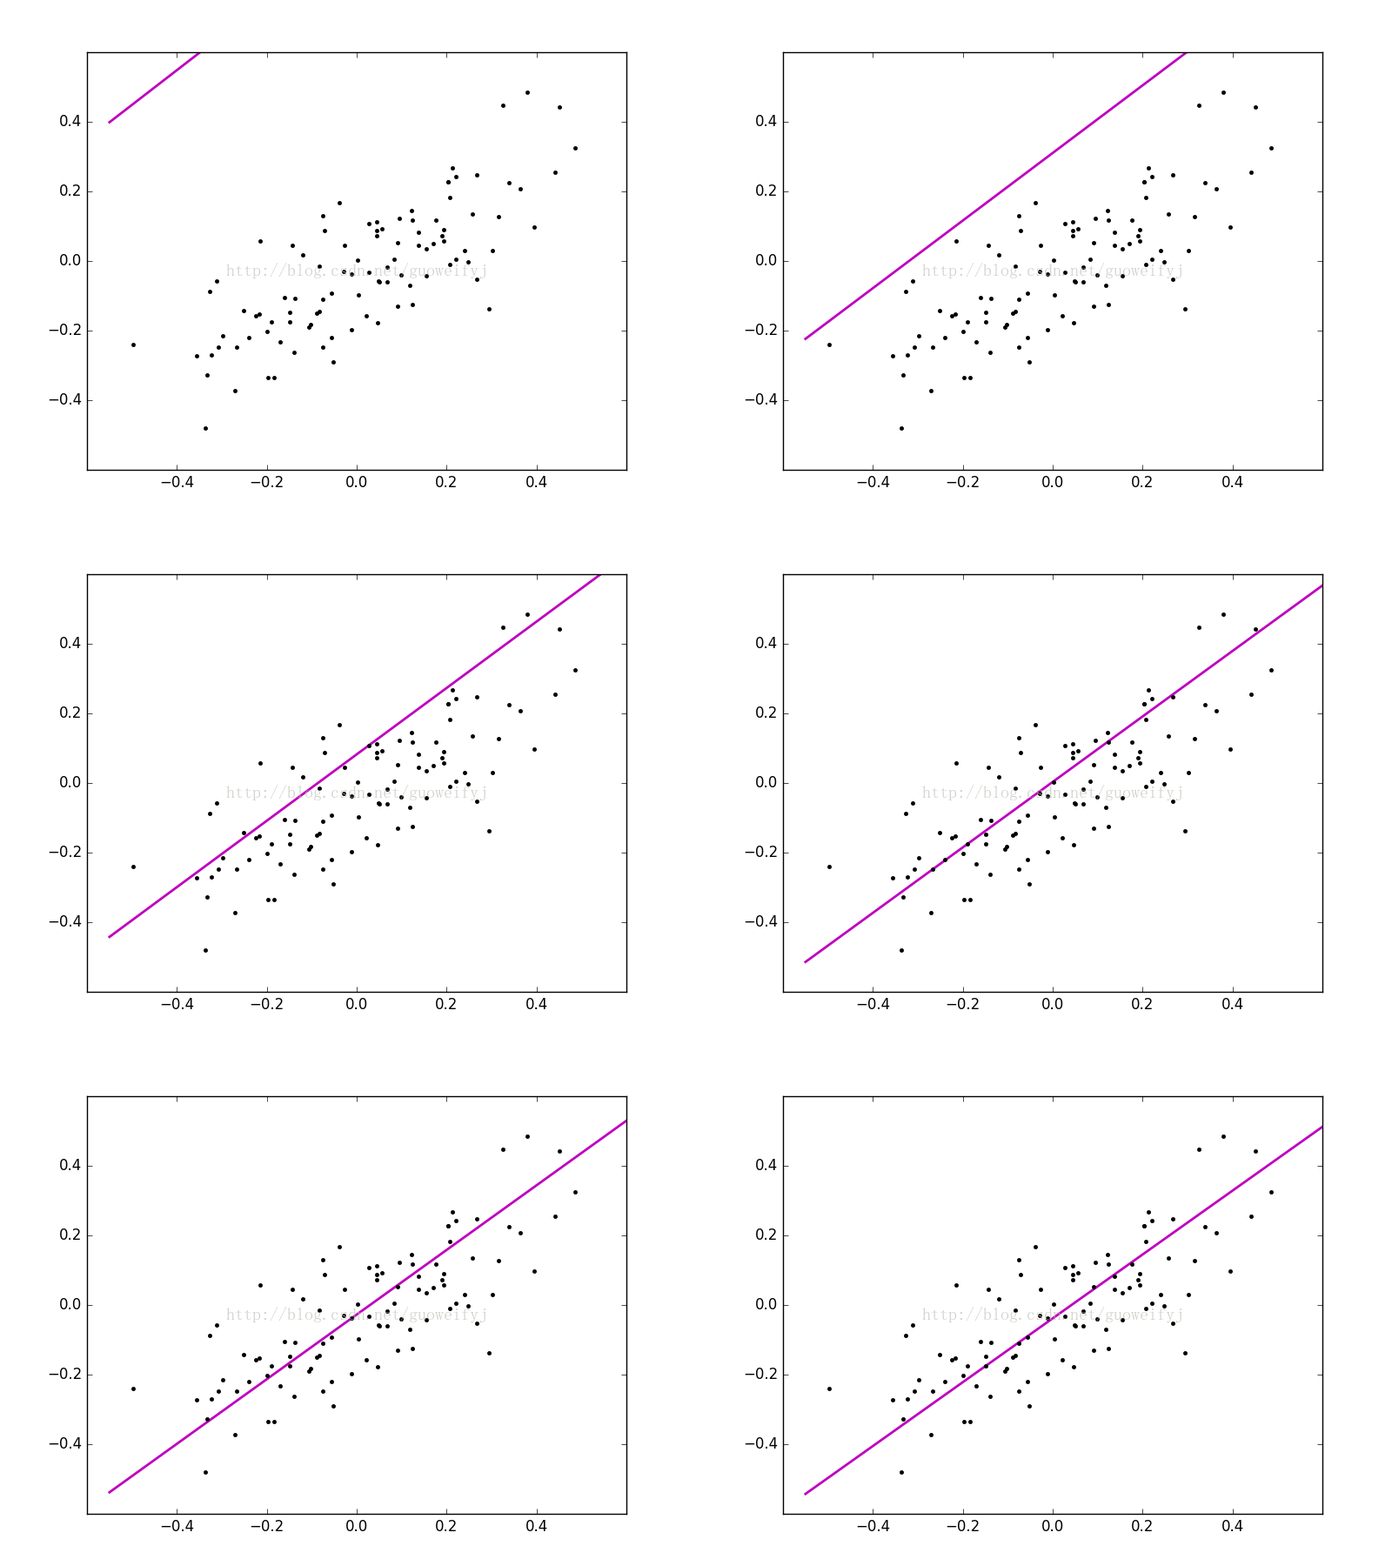
【Stanford|斯坦福-机器学习:线性回归-单特征梯度下降+动态图】python3实现
说明: 本文内容为【吴恩达-Stanford University Machine Learning】的学习总结笔记。
概念:
在吴恩达老师斯坦福机器学习教程第一讲,使用监督方法-线性回归建立模型,线性预估模型函数:
设其中X0=1,则有:
使用梯度下降方法计算参数θ:
取得参数θ,即可使用线性回归模型预测数据。
本文内容主要目的是了解梯度下降的实现,及掌握使用matplotlib 库animation可视化梯度下降过程的方法。更多的概念请参考:
- 网易公开课 斯坦福机器学习教程视频,搜机器学习即可;
- 网上有很多个人博客有很好的总结:机器学习算法入门之(一) 梯度下降法实现线性回归 、 机器学习入门:线性回归及梯度下降
python实例:单梯度下降+动图过程
按以下步骤实现线性回归-梯度下降:
- 获取数据(可能会有复杂的ETL过程);
- 特征缩放;
- 梯度下降;
- 使用matplotlib 库animation动图记录梯度下降过程;
一、获取数据
备注:脚本中涉及数据来自测试数据示例数据。
# 打开训练集文件
    f = open(r"F:\Users\Share\python\data.csv", "r")
    rows = f.readlines()
    # 设训练集为房屋价格
    x1 = []  # 房屋大小 平方米 x∈(25,71) avg=48
    y1 = []  # 房屋价格 万 y∈(30,120) avg=75
    # 转列表存储
    for row in [value.split(",") for value in rows]:
        x1.append(float(row[0]))
        y1.append(float(row[1]))
    # 关闭打开的文件
    f.close()
二、特征缩放
在进行模型训练前,需要对数据进行特征缩放:
将不同特征数据缩放到同一个相似区间内。
# 【1】特征缩放 X:=[X-mean(X)]/std(X) || X:=[X-min(X)]/max(X)-min(X) ;
def feature_scaling(data_set):
    # 特征缩放参数
    max_value = data_set.max(0)
    min_value = data_set.min(0)
    # avg_value = (min_value + max_value)/2
    diff_value = max_value - min_value
    norm_data_set = zeros(shape(data_set))  # 初始化与data_set结构一样的零array
    m = data_set.shape[0]
    norm_data_set = data_set - tile(min_value, (m, 1))  # avg_value
    norm_data_set = norm_data_set/tile(diff_value, (m, 1))
    return norm_data_set, diff_value, min_value
三、单特征梯度下降
(1)线性模型函数:# def hy(theta, x_sample):
# # hypothsis = theta0 + theta1 * x1 + theta2 * x2 .....
# temp = [thetai * xi for thetai, xi in zip(theta, x_sample)]
# result = sum(temp)
# return result
def create_hy(θ1, θ0):
return lambda xi: θ1*xi + θ0# 【2】梯度下降 hypothsis = theta0 + theta1 * x1 + theta2 * x2 .....
# α=0.001 0.01 0.03 0.1 0.3 1 3 10
def step_gradient(xa, ya, α=0.001, variance=0.00001):
# init the parameters to zero
θ0_temp = θ1_temp = 1.
θ0_last = θ1_last = 100.
reduction = 1
# 循环
while reduction > variance:
hypothesis = create_hy(θ1_temp, θ0_temp)
m = len(xa)
# 计算θ0、θ1
θ0_temp -= α * (1./2) * sum([hypothesis(xa[i]) - ya[i] for i in range(m)])
θ1_temp -= α * (1./2) * sum([(hypothesis(xa[i]) - ya[i]) * xa[i] for i in range(m)])
# 存储梯度下降过程theta0,theta1
theta.append((θ0_temp, θ1_temp))
# 画线
# for xxi in xx:
# yy.append((xxi, theta0_guess+theta1_guess*xxi))
reduction = min(abs(θ0_temp - θ0_last), abs(θ1_temp - θ1_last))
θ0_last = θ0_temp
θ1_last = θ1_temp
return θ0_temp, θ1_temp, theta四、animation动图展示梯度下降过程
使用animation下FuncAnimation函数可以生成动图,记录梯度下降过程,有助于更清晰的掌握算法优化过程,FuncAnimation方法需要两个函数,一个是init()初始化函数,一个是动画循环函数animate,具体如下:
(1)初始化函数:
# 初始化动画节点
def init():
line.set_data([], [])
plt.plot(x, y, 'bo')
plt.title('house detail')
plt.xlabel('size')
plt.ylabel('price')
return line# 动画循环
def animate(i):
global ax, line, label
yy = []
θ = thetaArr[i]
for xxi in xx:
yy.append(θ[0]+xxi*θ[1])
line.set_data(xx, yy)
label.set_position([θ[0], θ[1]])
return line, label(3)保存成动图:
# animation动态记录
anim = animation.FuncAnimation(fig, animate, init_func=init, frames=len(theta), interval=1000, repeat=True)
# 要保存gif 调小frames参数
anim.save('D:\MeetYou\Learning\MachineLearning\GradientDescent\GradientDescent.gif'
, writer='imagemagick', fps=1)五、完整测试代码实现
# coding=utf-8
# 线性回归-单特征梯度下降练习
from numpy import *
import matplotlib.pyplot as plt
from matplotlib import animation
import numpy as np
# 【1】特征缩放 X:=[X-mean(X)]/std(X) || X:=[X-min(X)]/max(X)-min(X) ;
def feature_scaling(data_set):
# 特征缩放参数
max_value = data_set.max(0)
min_value = data_set.min(0)
# avg_value = (min_value + max_value)/2
diff_value = max_value - min_value
norm_data_set = zeros(shape(data_set)) # 初始化与data_set结构一样的零array
m = data_set.shape[0]
norm_data_set = data_set - tile(min_value, (m, 1)) # avg_value
norm_data_set = norm_data_set/tile(diff_value, (m, 1))
return norm_data_set, diff_value, min_value
# def hy(theta, x_sample):
#      # hypothsis = theta0 + theta1 * x1 + theta2 * x2 .....
#     temp = [thetai * xi for thetai, xi in zip(theta, x_sample)]
#     result = sum(temp)
#     return result
def create_hy(θ1, θ0):
    return lambda xi: θ1*xi + θ0
# 【2】梯度下降 hypothsis = theta0 + theta1 * x1 + theta2 * x2 .....
# α=0.001 0.01 0.03 0.1 0.3 1 3 10
def step_gradient(xa, ya, α=0.001, variance=0.00001):
# init the parameters to zero
θ0_temp = θ1_temp = 1.
θ0_last = θ1_last = 100.
reduction = 1
# 循环
while reduction > variance:
hypothesis = create_hy(θ1_temp, θ0_temp)
m = len(xa)
# 计算θ0、θ1
θ0_temp -= α * (1./2) * sum([hypothesis(xa[i]) - ya[i] for i in range(m)])
θ1_temp -= α * (1./2) * sum([(hypothesis(xa[i]) - ya[i]) * xa[i] for i in range(m)])
# 存储梯度下降过程theta0,theta1
theta.append((θ0_temp, θ1_temp))
# 画线
reduction = min(abs(θ0_temp - θ0_last), abs(θ1_temp - θ1_last))
θ0_last = θ0_temp
θ1_last = θ1_temp
return θ0_temp, θ1_temp, theta
# 主方法
if __name__ == "__main__":
# 打开训练集文件
f = open(r"F:\Users\Share\python\data.csv", "r")
rows = f.readlines()
# 设训练集为房屋价格
x1 = [] # 房屋大小 平方米 x∈(25,71) avg=48
y1 = [] # 房屋价格 万 y∈(30,120) avg=75
# 转列表存储
for row in [value.split(",") for value in rows]:
x1.append(float(row[0]))
y1.append(float(row[1]))
# 关闭打开的文件
f.close()
# 特征缩放
# x, y = feature_scaling1(x1, y1)
x, diff_x, min_x = feature_scaling(np.array(x1))
y, diff_y, min_y = feature_scaling(np.array(y1))
theta = []
# 线性回归:单特征梯度下降
t0, t1, thetaArr = step_gradient(x.tolist()[0], y.tolist()[0])
print("Final result: theta0_guess:%f theta1_guess:%f" % (t0, t1))
# 绘图
fig = plt.figure()
# ax = plt.axes(xlim=(-0.6, 0.6), ylim=(-0.6, 0.6))
ax = plt.axes(xlim=(-0.5, 1.5), ylim=(-0.5, 1.2))
line, = ax.plot([], [], color='m', linewidth=2)
label = ax.text([], [], '')
 # 初始化动画节点
    def init():
        line.set_data([], [])
        plt.plot(x, y, 'bo')
        plt.title('house detail')
        plt.xlabel('size')
        plt.ylabel('price')
        return line
xx = [-0.55, 0.0, 0.34, 0.78] # 画线点
# 动画循环
    def animate(i):
        global ax, line, label
        yy = []
        θ = thetaArr[i]
        for xxi in xx:
            yy.append(θ[0]+xxi*θ[1])
        line.set_data(xx, yy)
        label.set_position([θ[0], θ[1]])
        return line, label
# animation动态记录
    anim = animation.FuncAnimation(fig, animate, init_func=init, frames=len(theta), interval=1000, repeat=True)
    # 要保存gif 调小frames参数
    anim.save('D:\MeetYou\Learning\MachineLearning\GradientDescent\GradientDescent.gif'
              , writer='imagemagick', fps=1)
plt.show()
总结:
从以上python实现示例可以看出:
- 批梯度下降的收敛速度会比较慢;
- 必要的特征缩放;
- 必要的animation动图,让你更了解梯度下降过程。
--------------------------------------------我是分割线--------------------------------------------
高峰屹立,积跬步,行不止。

