YOLO学习】召回率(Recall),精确率(Precision),平均正确率(Average_precision(AP) ),交除并(Intersection-over-Union(IoU))
译文可以参考: https://blog.csdn.net/h
Tag: average precision
It’s a bird… it’s a plane… it… depends on your classifier’s threshold
Evaluation of an information retrieval system (a search engine, for example) generally focuses on two things:
1. How relevant are the retrieved results? (precision)
2. Did the system retrieve many of the truly relevant documents? (recall)
For those that aren’t familiar, I’ll explain what precision and recall are, and for those that are familiar, I’ll explain some of the confusion in the literature when comparing precision-recall curves.
Geese and airplanes
Suppose you have an image collection consisting of airplanes and geese.
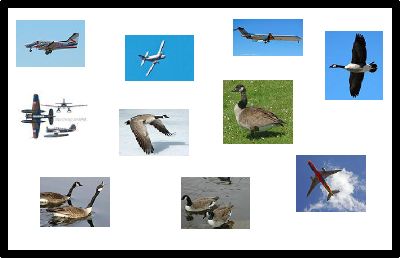
You want your system to retrieve all the airplane images and none of the geese images.
Given a set of images that your system retrieves from this collection, we can define four accuracy counts:
True positives: Airplane images that your system correctly retrieved
True negatives: Geese images that your system correctly did not retrieve
False positives: Geese images that your system incorrectly retrieved, believing them to be airplanes
False negatives: Airplane images that your system did incorrectly did not retrieve, believing them to be geese

In this example retrieval, there are three true positives and one false positive.
Using the terms I just defined, in this example retrieval, there are three true positives and one false positive. How many false negatives are there? How many true negatives are there?
There are two false negatives (the airplanes that the system failed to retrieve) and four true negatives (the geese that the system did not retrieve).
Precision and recall
Now, you’ll be able to understand more exactly what precision and recall are.
Precision is the percentage true positives in the retrieved results. That is:
![]()
where n is equal to the total number of images retrieved (tp + fp).
Recall is the percentage of the airplanes that the system retrieves. That is:
![]()
In our example above, with 3 true positives, 1 false positive, 4 true negatives, and 2 false negatives, precision = 0.75, and recall = 0.6.
75% of the retrieved results were airplanes, and 60% of the airplanes were retrieved.
Adjusting the threshold
What if we’re not happy with that performance? We could ask the system to return more examples. This would be done be relaxing our threshold of what we want our system to consider as an airplane. We could also ask our system to be more strict, and return fewer examples. In our example so far, the system retrieved four examples. That corresponds to a particular threshold (shown below by a blue line). The system retrieved the examples that appeared more airplane-like than that threshold.

This is a hypothetical ordering that our airplane retrieval system could give to the images in our collection. More airplane-like are at the top of the list. The blue line is the threshold that gave our example retrieval.
We can move that threshold up and down to get a different set of retrieved documents. At each position of the threshold, we would get a different precision and recall value. Specifically, if we retrieved only the top example, precision would be 100% and recall would be 20%. If we retrieved the top two examples, precision would still be 100%, and recall will have gone up to 40%. The following chart gives precision and recall for the above hypothetical ordering at all the possible thresholds.
| Retrieval cutoff | Precision | Recall |
| Top 1 image | 100% | 20% |
| Top 2 images | 100% | 40% |
| Top 3 images | 66% | 40% |
| Top 4 images | 75% | 60% |
| Top 5 images | 60% | 60% |
| Top 6 images | 66% | 80% |
| Top 7 images | 57% | 80% |
| Top 8 images | 50% | 80% |
| Top 9 images | 44% | 80% |
| Top 10 images | 50% | 100% |
Precision-recall curves
A good way to characterize the performance of a classifier is to look at how precision and recall change as you change the threshold. A good classifier will be good at ranking actual airplane images near the top of the list, and be able to retrieve a lot of airplane images before retrieving any geese: its precision will stay high as recall increases. A poor classifier will have to take a large hit in precision to get higher recall. Usually, a publication will present a precision-recall curve to show how this tradeoff looks for their classifier. This is a plot of precision p as a function of recall r.

The precision-recall curve for our example airplane classifier. It can achieve 40% recall without sacrificing any precision, but to get 100% recall, its precision drops to 50%.
Average precision
Rather than comparing curves, its sometimes useful to have a single number that characterizes the performance of a classifier. A common metric is the average precision. This can actually mean one of several things.
Average precision
Strictly, the average precision is precision averaged across all values of recall between 0 and 1:
![]()
That’s equal to taking the area under the curve. In practice, the integral is closely approximated by a sum over the precisions at every possible threshold value, multiplied by the change in recall:
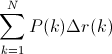
where N is the total number of images in the collection, P(k) is the precision at a cutoff of k images, and delta r(k) is the change in recall that happened between cutoff k-1 and cutoff k.
In our example, this is (1 * 0.2) + (1 * 0.2) + (0.66 * 0) + (0.75 * 0.2) + (0.6 * 0) + (0.66 * 0.2) + (0.57 * 0) + (0.5 * 0) + (0.44 * 0) + (0.5 * 0.2) = 0.782.
Notice that the points at which the recall doesn’t change don’t contribute to this sum (in the graph, these points are on the vertical sections of the plot, where it’s dropping straight down). This makes sense, because since we’re computing the area under the curve, those sections of the curve aren’t adding any area.
Interpolated average precision
Some authors choose an alternate approximation that is called the interpolated average precision. Often, they still call it average precision. Instead of using P(k), the precision at a retrieval cutoff of k images, the interpolated average precision uses:
![]()
In other words, instead of using the precision that was actually observed at cutoff k, the interpolated average precision uses the maximum precision observed across all cutoffs with higher recall. The full equation for computing the interpolated average precision is:

Visually, here’s how the interpolated average precision compares to the approximated average precision (to show a more interesting plot, this one isn’t from the earlier example):

The approximated average precision closely hugs the actually observed curve. The interpolated average precision over estimates the precision at many points and produces a higher average precision value than the approximated average precision.
Further, there are variations on where to take the samples when computing the interpolated average precision. Some take samples at a fixed 11 points from 0 to 1: {0, 0.1, 0.2, …, 0.9, 1.0}. This is called the 11-point interpolated average precision. Others sample at every k where the recall changes.
Confusion
Some important publications use the interpolated average precision as their metric and still call it average precision. For example, the PASCAL Visual Objects Challenge has used this as their evaluation metric since 2007. I don’t think their justification is strong. They say, “the intention in interpolating the precision/recall curve in this way is to reduce the impact of the “wiggles” in the precision/recall curve”. Regardless, everyone compares against each other on this metric, so within the competition, this is not an issue. However, the rest of us need to be careful when comparing “average precision” values against other published results. Are we using the VOC’s interpolated average precision, while previous work had used the non-interpolated average precision? This would incorrectly show improvement of a new method when compared to the previous work.
Summary
Precision and recall are useful metrics for evaluating the performance of a classifier.
Precision and recall vary with the strictness of your classifier’s threshold.
There are several ways to summarize the precision-recall curve with a single number called average precision; be sure you’re using the same metric as the previous work that you’re comparing with.
ysteric314/article/details/54093734