python最小二乘的实现
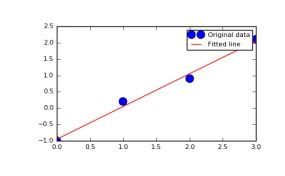
1.使用 linalg最小二乘法的权重参数(m,c)。
import matplotlib.pyplot as plt

x=Aarray([[ 0.,  1.],       [ 1.,  1.],       [ 2.,  1.],       [ 3.,  1.]])
y = np.array([-1, 0.2, 0.9, 2.1])
m, c = np.linalg.lstsq(x, y)[0]


plt.plot(x, y, 'o', label='Original data', markersize=10)
plt.plot(x, m*x + c, 'r', label='Fitted line')
plt.legend()
plt.show()
2.使用Scipy
导入scipy的最小二乘法优化器:from scipy.optimize import leastsq
import numpy as np
from scipy.optimize import leastsq
import matplotlib.pyplot as plt

plt.rcParams['font.sans-serif'] = ['SimHei']  # 用来正常显示中文标签
plt.rcParams['axes.unicode_minus'] = False  # 用来正常显示负号


# np.random.seed(0)


def obj_func(x):
    # 创建目标函数,后面假设不知道,需要拟合出来接近这个目标函数
    # f = 1 / (1 + np.exp(-x))
    # f = np.tan(x)
    f = np.sin(x)
    return f


size = 100
x = np.linspace(-5, 5, size)
y_ = obj_func(x)
# 根据目标函数,产生随机的噪声,近似接近目标函数obj_func的数据x,y
y = np.random.normal(0, 1, (size)) / 100 + y_


def scatter(x, y, c, label):
    plt.scatter(x, y, label=label, c=c)


def plot(x, y, c, label):
    plt.plot(x, y, label=label, c=c)


# 创建拟合函数,参数为p的多项式函数,去拟合obj_func
def fit_func(p, x):
    # poly1d([2, 1, 1]) 等同于2*x^2  + 1* x^1 +1*x^0 = 2x^2 + x +1
    f = np.poly1d(p)
    return f(x)


# 创建损失函数,Scipy优化器依照损失最小化取优化,寻找最佳参数,这里既为多项式函数的系数,和偏置。
def coust_func(p, x, y):
    f = fit_func(p, x)
    # 定义为残差最小
    coust = (f - y)
    return coust


# 还可以定义正则化损失
regularization = 0.0001


def coust_func_regularization(p, x, y):
    f = fit_func(p, x)
    reg = np.sqrt(0.5 * regularization * np.square(p))
    coust = (f - y)
    coust = np.append(coust, reg)
    return coust


# 适配函数
def fiting_func(x, y, coust_func, M=1):
    init_p = np.random.rand(M + 1)
    # scipy最小二乘函数,传入:(损失函数,损失函数初始参数,(数据x,y))
    leastq = leastsq(coust_func, init_p, args=(x, y))
    return leastq


# -------绘制真实函数-------
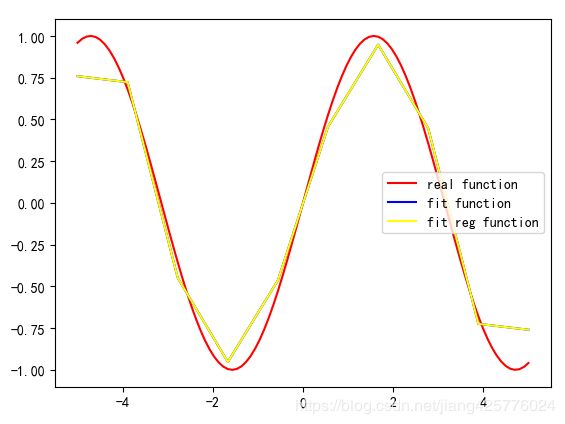
plot(x, y_, c='red', label='real function')

# 多项式拟合中的最高次
p = 5
# 无正则化损失函数
leastq = fiting_func(x, y, coust_func, p)
# 正则化损失函数
leastq_reg = fiting_func(x, y, coust_func_regularization, p)

pred_x = np.linspace(-5, 5, 10)
# 预测
predY = fit_func(leastq[0], pred_x)
predY_reg = fit_func(leastq_reg[0], pred_x)

# -------拟合函数-------
plot(pred_x, predY, c='blue', label='fit function')
# -------正则拟合函数-------
plot(pred_x, predY_reg, c='yellow', label='fit reg function')
plt.legend()
plt.show()

