TensorFlow入门教程:10:数据的可视化显示

数据进行可视化显示有助于更好的理解数据,这篇文章只是为了简单地做一些基础的准备,将会使用前面介绍过的Iris数据集,对其数据的分布根据属性的不同进行展示。
matplotlib绘图

matplotlib是python的一个开源的2D绘图库,被广泛地应用于机器学习结果的展示,在这系列的文章中我们也会使用matplotlib进行演示,简单的介绍信息可以参看:
- https://blog.csdn.net/liumiaocn/article/details/80728030
使用说明
依赖
- 需要使用pip安装matplotlib
- 使用前需要import相关的库:import matplotlib.pyplot as plt
常用函数说明
| 函数名称 | 使用说明 |
|---|---|
| plt.xlabel(xlable) | 设置x轴显示内容 |
| plt.ylabel(ylable) | 设置y轴显示内容 |
| plt.title(title) | 设置图的标题显示内容 |
| plt.legend() | 设置图形凡例显示 |
| plt.show() | 绘制图形并显示 |
| plt.plot | 设定显示数据与形式 |
显示形式
常见的显示设定如下所示:
| 类型 | 标记 | 描述 |
|---|---|---|
| 颜色 | b | blue |
| 颜色 | g | green |
| 颜色 | r | red |
| 颜色 | c | cyan |
| 颜色 | m | magenta |
| 颜色 | Y | yellow |
| 颜色 | k | black |
| 颜色 | w | white |
| 线型 | - | solid |
| 线型 | – | dashed |
| 线型 | -. | dash_dot |
| 线型 | : | dotted |
| 线型 | None | draw nothing |
| 线型 | ‘’ | draw nothing |
| 线型 | ‘’ | draw nothing |
| 标记 | o | circle |
| 标记 | v | triangle_down |
| 标记 | s | square |
| 标记 | p | pentagon |
| 标记 | * | star |
| 标记 | h | hexagon1 |
| 标记 | + | plus |
| 标记 | D | diamond |
Iris数据集特点
三个种类
数据集主要包括如下三个种类鸢尾花的数据,每种50条数据
| 类别 | 名称 |
|---|---|
| Iris Setosa | 山鸢尾 |
| Iris Versicolour | 杂色鸢尾 |
| Iris Virginica | 维吉尼亚鸢尾 |
四个特征
每条数据都从鸢尾花的如下四个特征进行描述
| 特征 | 说明 |
|---|---|
| Sepal.Length | 花萼长度 |
| Sepal.Width | 花萼宽度 |
| Petal.Length | 花瓣长度 |
| Petal.Width | 花瓣宽度 |
数据演示
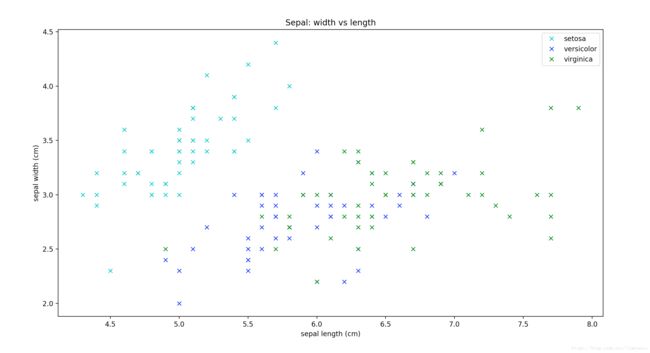
角度1: 花萼长度 x 花萼宽度
feature = data.data
kind = data.target
xlable = data.feature_names[0]
ylable = data.feature_names[1]
title  = "Sepal: width vs length"
plt.plot(feature[:, 0][kind==0], feature[:, 1][kind==0], 'cx', label=data.target_names[0])
plt.plot(feature[:, 0][kind==1], feature[:, 1][kind==1], 'bx', label=data.target_names[1])
plt.plot(feature[:, 0][kind==2], feature[:, 1][kind==2], 'gx', label=data.target_names[2])
plt.xlabel(xlable)
plt.ylabel(ylable)
plt.title(title)
plt.legend()
plt.show()
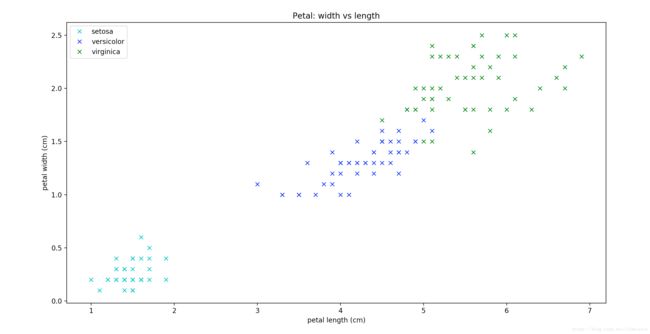
角度2: 花瓣长度 x 花瓣宽度
xlable = data.feature_names[2]
ylable = data.feature_names[3]
title  = "Petal: width vs length"
plt.plot(feature[:, 2][kind==0], feature[:, 3][kind==0], 'cx', label=data.target_names[0])
plt.plot(feature[:, 2][kind==1], feature[:, 3][kind==1], 'bx', label=data.target_names[1])
plt.plot(feature[:, 2][kind==2], feature[:, 3][kind==2], 'gx', label=data.target_names[2])
plt.xlabel(xlable)
plt.ylabel(ylable)
plt.title(title)
plt.legend()
plt.show()
示例代码
liumiaocn:Notebook liumiao$ cat basic-operation-5.py
import tensorflow as tf
import os
from sklearn import datasets
import matplotlib.pyplot as plt

os.environ['TF_CPP_MIN_LOG_LEVEL'] = '2'

print("\n##iris dataset load:  datasets.load_iris")
data =  datasets.load_iris()
#print(data.DESCR)
#print(dir(data))
#print(data.data)
#print(data.feature_names)
#print(data.target)
#print(data.target_names)

feature = data.data
kind = data.target
xlable = data.feature_names[0]
ylable = data.feature_names[1]
title  = "Sepal: width vs length"
plt.plot(feature[:, 0][kind==0], feature[:, 1][kind==0], 'cx', label=data.target_names[0])
plt.plot(feature[:, 0][kind==1], feature[:, 1][kind==1], 'bx', label=data.target_names[1])
plt.plot(feature[:, 0][kind==2], feature[:, 1][kind==2], 'gx', label=data.target_names[2])
plt.xlabel(xlable)
plt.ylabel(ylable)
plt.title(title)
plt.legend()
plt.show()

xlable = data.feature_names[2]
ylable = data.feature_names[3]
title  = "Petal: width vs length"
plt.plot(feature[:, 2][kind==0], feature[:, 3][kind==0], 'cx', label=data.target_names[0])
plt.plot(feature[:, 2][kind==1], feature[:, 3][kind==1], 'bx', label=data.target_names[1])
plt.plot(feature[:, 2][kind==2], feature[:, 3][kind==2], 'gx', label=data.target_names[2])
plt.xlabel(xlable)
plt.ylabel(ylable)
plt.title(title)
plt.legend()
plt.show()


liumiaocn:Notebook liumiao$
执行确认
执行后可到如下两幅数据的可视化显示
角度1: 花萼长度 x 花萼宽度
角度2: 花瓣长度 x 花瓣宽度
为什么需要进行可视化分析从上述两幅图可以清晰的看出来,我们尚未使用任何算法,只是将数据按照不同角度进行展示,可以看到按照三种不同鸢尾花的数据按花瓣的长度和宽度的分布非常规律,种类清晰,规律性也很强。
而和算法进行结合这些数据又能体现出什么样的结论,在后面将会进一步展开。
参考内容
http://matplotlib.org/api/pyplot_api.html#matplotlib.pyplot.annotate

