Python使用pyecharts绘制cpu使用量折线图
文章目录
- 1.基本步骤:
- 1.1获取主机时间与cpu使用量情况
- 1.2 获取到的信存入到新的文件中,方便绘图调用
- 1.3 创建两个列表分别代表横纵坐标轴的数据
- 1.4 利用pyechart工具生成折线图
- 2.pyecharts自主学习
1.基本步骤:
1.1获取主机时间与cpu使用量情况
import psutil   #导入系统库,在后面获取cpu使用量需要用到
import time   #导入时间库,获取时间需要用到
from pyecharts  import options as opts   #pyecharts库,用于绘制图表
from pyecharts.charts import Line  # 折线图绘制模块

i=0
while i<10: #这里获取十组数据为例
    t=time.localtime()
    cur_time='%d:%d:%d' %(t.tm_hour ,t.tm_min ,t.tm_sec )
    cpu_res=psutil.cpu_percent()
    #print(cur_time ,cpu_res)
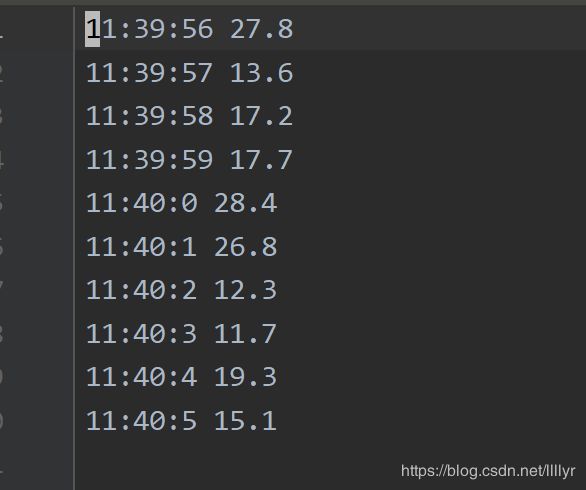
1.2 获取到的信存入到新的文件中,方便绘图调用
with open('cpu.txt','a+') as f:  #with自动关闭文件
    f.write('%s %s \n'%(cur_time,cpu_res))
time.sleep(1)
i+=1
1.3 创建两个列表分别代表横纵坐标轴的数据
x=[]
y=[]
with open ('cpu.txt') as k:
    for line in k :
        time,per=line.split()
        x.append(time)
        y.append(per)
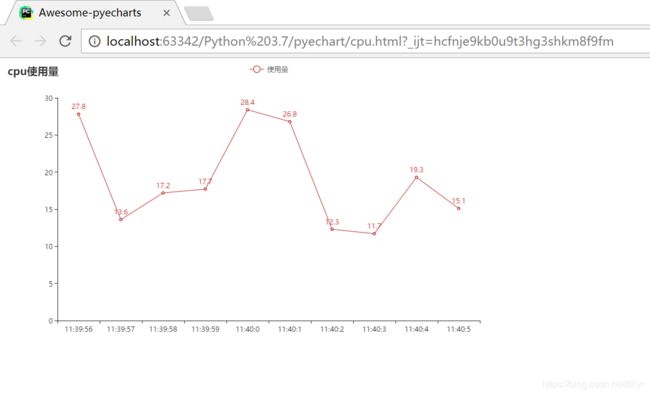
1.4 利用pyechart工具生成折线图
line=(
        Line()
        .add_xaxis(x)
        .add_yaxis("使用量",y)

        .set_global_opts(title_opts=opts.TitleOpts(title="cpu使用量"))
     )

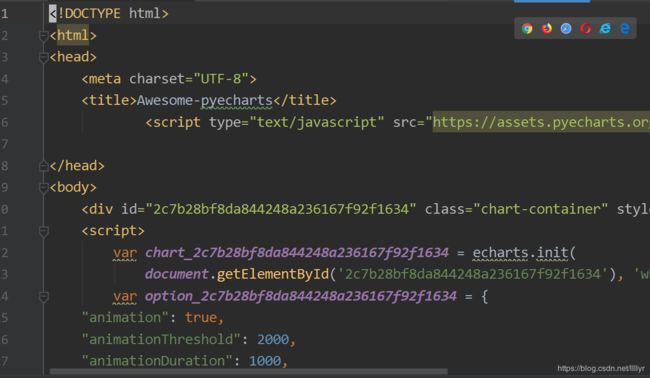
line.render('cpu.html') #生成"cpu.html"HTML文件 在浏览器中打开 即可看到折线图
2.pyecharts自主学习
学习源:pyecharts_study


