霍夫变换检测直线
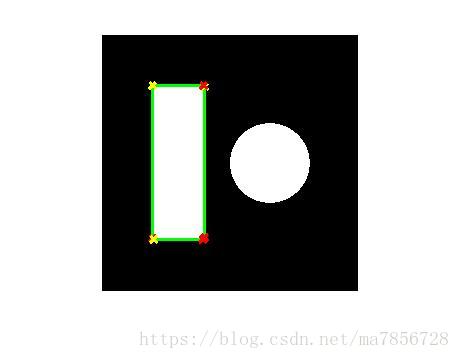
对于线性目标提取时,霍夫变换是个很好的手段,博主在这里做了仿真实验,在一个图像中画上圆和矩形,通过霍夫变换提取矩形的边缘。编译环境为matlab2014a,代码如下。
%%%%%%%%%%%%%%%%%%%%%%%霍夫变换,找到矩形图像的边界,用彩色表示出来,矩形和圆不重叠
clc; clear all; close all;
I = zeros(256, 256);
[r, c] = size(I);
I(floor(1/5*r:4/5*r), floor(1/5*c:2/5*c)) = 1;
x = linspace(-c/2,c/2,c);
y = linspace(-r/2,r/2,r);
[x,y] = meshgrid(x,y);
D = sqrt((x-40).^2 + y.^2);
I(D<=40) = 1;
BW = edge(I,'sobel');
%% 霍夫变换
[H,T,R] = hough(BW);
imshow(H,[],'XData',T,'YData',R,'InitialMagnification','fit');
xlabel('\theta'), ylabel('\rho');
axis on,axis normal,  hold on;
%% 提取极值点
P = houghpeaks(H,4,'threshold',ceil(0.1*max(H(:))));    %提取4个极值点,threshold为阈值设置,返回行列坐标
x = T(P(:,2));                                          %横坐标
y = R(P(:,1));                                          %纵坐标
plot(x,y,'s','color','white');
%% 找图中的线
% 找到线段
lines = houghlines(BW,T,R,P,'FillGap',4,'MinLength',7);%FillGap,小于指定值时,合并线段。MinLength,比制定值小的线段丢弃
figure, imshow(I), hold on
max_len = 0;
for k = 1:length(lines)
        xy = [lines(k).point1; lines(k).point2];
        plot(xy(:,1),xy(:,2),'LineWidth',2,'Color','green');

        % 画线段的起始和终止点
        plot(xy(1,1),xy(1,2),'x','LineWidth',2,'Color','yellow');
        plot(xy(2,1),xy(2,2),'x','LineWidth',2,'Color','red');
end
结果如下
