(openCV 十九)轮廓Contours形状拟合
什么是轮廓?
轮廓可以简单认为成将连续的点(连着边界)连在一起的曲线,具有相同 的颜色或者灰度。轮廓在形状分析和物体的检测和识别中很有用。
• 为了更加准确,要使用二值化图像。在寻找轮廓之前,要进行阈值化处理 或者 Canny 边界检测。
• 查找轮廓的函数会修改原始图像。如果你在找到轮廓之后还想使用原始图 像的话,你应该将原始图像存储到其他变量中。
• 在 OpenCV 中,查找轮廓就像在黑色背景中超白色物体。你应该记住, 要找的物体应该是白色而背景应该是黑色。
如何在一个二值图像中查找轮廓?
函数 cv2.findContours()
输入参数:有三个,第一个是输入图像,第二个是 轮廓检索模式,第三个是轮廓近似方法。第三个参数设置为cv2.CHAIN_APPROX_NONE,所有的边界点 都会被存储;设置为cv2.CHAIN_APPROX_SIMPLE 将轮廓冗余的点去掉,压缩轮廓,节省内存开销。

返回值:有三个,第一个是图像,第二个 是轮廓,第三个是(轮廓的)层析结构。轮廓(第二个返回值)是一个 Python
列表,其中存储这图像中的所有轮廓。每一个轮廓都是一个 Numpy 数组,包 含对象边界点(x,y)的坐标。
im = cv2.imread('test.jpg')
imgray = cv2.cvtColor(im,cv2.COLOR_BGR2GRAY)
ret,thresh = cv2.threshold(imgray,127,255,0)
image, contours, hierarchy = cv2.findContours(thresh,cv2.RETR_TREE,cv2.CHAIN_APPROX_SIMPLE)
怎样绘制轮廓?
函数 cv2.drawContours() 可以被用来绘制轮廓。它可以根据你提供 的边界点绘制任何形状。它的第一个参数是原始图像,第二个参数是轮廓,一 个 Python 列表。第三个参数是轮廓的索引(在绘制独立轮廓是很有用,当设 置为 -1 时绘制所有轮廓)。接下来的参数是轮廓的颜色和厚度等。
img = cv2.drawContour(img, contours, -1, (0,255,0), 3)
img = cv2.drawContours(img, contours, 3, (0,255,0), 3)
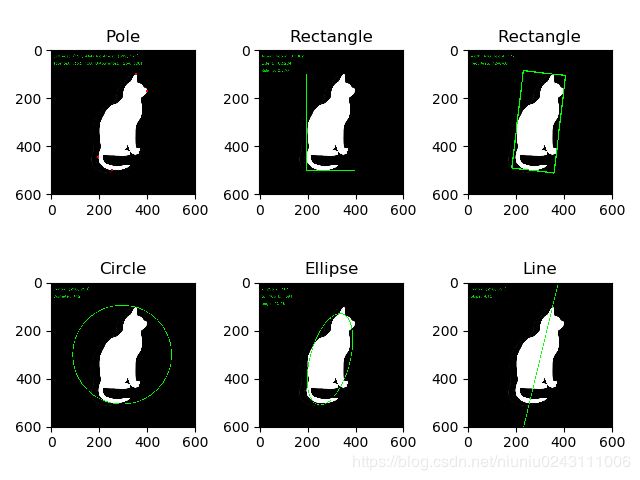
轮廓形状拟合 1 边界矩形 1.1 直边界矩形 一个直矩形(就是没有旋转的矩形)。它不会考虑对象是否旋转。 所以边界矩形的面积不是最小的。可以使用函数 cv2.boundingRect() 查找得到。 (x,y)为矩形左上角的坐标,(w,h)是矩形的宽和高。 x,y,w,h = cv2.boundingRect(array) array:轮廓点,常用contours[0] (x,y)为矩形左上角的坐标,(w,h)是矩形的宽和高。 注:例子在最后 1.2 旋转的边界矩形 这个边界矩形是面积最小的,因为它考虑了对象的旋转。用 到的函数为 cv2.minAreaRect()。 返回的是一个 Box2D 结构,其中包含 矩形左上角角点的坐标(x,y),矩形的宽和高(w,h),以及旋转角度。 但是 要绘制这个矩形需要矩形的 4 个角点,可以通过函数 cv2.boxPoints() 获 得。 rect = cv2.minAreaRect(points) points:轮廓点,常用contours[0] rect:返回的是一个 Box2D 结构,其中包含 矩形左上角角点的坐标(x,y),矩形的宽和高(w,h),以及旋转角度。 但是 要绘制这个矩形需要矩形的 4 个角点,可以通过函数 cv2.boxPoints() 获得。 2 最小外接圆 函数 cv2.minEnclosingCircle() 可以帮我们找到一个对象的外切圆。 它是所有能够包括对象的圆中面积最小的一个。 (x, y), radius = cv2.minEnclosingCircle(points) points:轮廓点,常用contours[0] (x, y):圆心 radius:半径 3 椭圆拟合 使用的函数为 cv2.ellipse(),返回值其实就是旋转边界矩形的内切圆。 ellipse = cv2.fitEllipse(points) 或 (x,y),(a,b),angle = cv2.fitEllipse(points) points:轮廓点,常用contours[0] ellipse:可直接使用cv2.ellipse()画出椭圆 (x,y):椭圆中心 (a,b):长轴短轴 angle:旋转角度 4 直线拟合 我们可以根据一组点拟合出一条直线,同样我们也可以为图像中的白色点 拟合出一条直线。 [vx, vy, x, y] = cv2.fitLine(points, distType, param, reps, aeps, line) points:二维点的数组 distType:距离类型 param:距离参数 reps:径向的精度参数 aeps:角度精度参数 line:输出直线 vx, vy:直线的方向 x, y:直线上一点 轮廓性质 1 长宽比 边界矩形的宽高比 2 Extent 轮廓面积与边界矩形面积的比。 3 Solidity 轮廓面积与凸包面积的比。4 Equivalent Diameter 与轮廓面积相等的圆形的直径 --------------------- 作者:YukinoSiro 来源:CSDN 原文:https://blog.csdn.net/yukinoai/article/details/87892718 版权声明:本文为博主原创文章,转载请附上博文链接! import cv2 import numpy as np from matplotlib import pyplot as plt font = cv2.FONT_HERSHEY_SIMPLEX # 设置字体样式 img = cv2.imread('img/cat.jpg') imgray = cv2.cvtColor(img, cv2.COLOR_BGR2GRAY) ret, thresh = cv2.threshold(imgray, 200, 255, 0) image, contours, hierarchy = cv2.findContours(thresh, cv2.RETR_TREE, cv2.CHAIN_APPROX_SIMPLE) cnt = contours[0] # 极点 img0 = img.copy() leftmost = tuple(cnt[cnt[:, :, 0].argmin()][0]) cv2.circle(img0, leftmost, 5, [0, 0, 255], -1) rightmost = tuple(cnt[cnt[:, :, 0].argmax()][0]) cv2.circle(img0, rightmost, 5, [0, 0, 255], -1) topmost = tuple(cnt[cnt[:, :, 1].argmin()][0]) cv2.circle(img0, topmost, 5, [0, 0, 255], -1) bottommost = tuple(cnt[cnt[:, :, 1].argmax()][0]) cv2.circle(img0, bottommost, 5, [0, 0, 255], -1) text1 = 'Leftmost: ' + str(leftmost) + ' Rightmost: ' + str(rightmost) text2 = 'Topmost: ' + str(topmost) + ' Bottommost: ' + str(bottommost) cv2.putText(img0, text1, (10, 30), font, 0.5, (0, 255, 0), 1, cv2.LINE_AA, 0) cv2.putText(img0, text2, (10, 60), font, 0.5, (0, 255, 0), 1, cv2.LINE_AA, 0) # 直边界矩形拟合 img1 = img.copy() x, y, w, h = cv2.boundingRect(cnt) area = cv2.contourArea(cnt) aspect_ratio = float(w)/h # 长宽比 rect_area = w*h extent = float(area)/rect_area # 轮廓面积与边界矩形面积的比。 hull = cv2.convexHull(cnt) hull_area = cv2.contourArea(hull) solidity = float(area)/hull_area # 轮廓面积与凸包面积的比。 cv2.rectangle(img1, (x, y), (x+w, y+h), (0, 255, 0), 2) text1 = 'Aspect Ration: ' + str(round(aspect_ratio, 4)) text2 = 'Extent: ' + str(round(extent, 4)) text3 = 'Solidity: ' + str(round(solidity, 4)) cv2.putText(img1, text1, (10, 30), font, 0.5, (0, 255, 0), 1, cv2.LINE_AA, 0) cv2.putText(img1, text2, (10, 60), font, 0.5, (0, 255, 0), 1, cv2.LINE_AA, 0) cv2.putText(img1, text3, (10, 90), font, 0.5, (0, 255, 0), 1, cv2.LINE_AA, 0) # 最小矩形拟合 img2 = img.copy() rect = cv2.minAreaRect(cnt) box = cv2.boxPoints(rect) box = np.int0(box) # 获得矩形角点 area = cv2.contourArea(box) width = rect[1][0] height = rect[1][1] cv2.polylines(img2, [box], True, (0, 255, 0), 3) text1 = 'Width: ' + str(int(width)) + ' Height: ' + str(int(height)) text2 = 'Rect Area: ' + str(area) cv2.putText(img2, text1, (10, 30), font, 0.5, (0, 255, 0), 1, cv2.LINE_AA, 0) cv2.putText(img2, text2, (10, 60), font, 0.5, (0, 255, 0), 1, cv2.LINE_AA, 0) # 圆拟合 img3 = img.copy() (x, y), radius = cv2.minEnclosingCircle(cnt) center = (int(x), int(y)) radius = int(radius) area = cv2.contourArea(cnt) equi_diameter = np.sqrt(4*area/np.pi) cv2.circle(img3, center, radius, (0, 255, 0), 2) text1 = 'Center: (' + str(int(x)) + ', ' + str(int(y)) + ') ' text2 = 'Diameter: ' + str(2*radius) cv2.putText(img3, text1, (10, 30), font, 0.5, (0, 255, 0), 1, cv2.LINE_AA, 0) cv2.putText(img3, text2, (10, 60), font, 0.5, (0, 255, 0), 1, cv2.LINE_AA, 0) # 椭圆拟合 img4 = img.copy() ellipse = cv2.fitEllipse(cnt) (x, y), (a, b), angle = cv2.fitEllipse(cnt) cv2.ellipse(img4, ellipse, (0, 255, 0), 2) text1 = 'x: ' + str(int(x)) + ' y: ' + str(int(y)) text2 = 'a: ' + str(int(a)) + ' b: ' + str(int(b)) text3 = 'angle: ' + str(round(angle, 2)) cv2.putText(img4, text1, (10, 30), font, 0.5, (0, 255, 0), 1, cv2.LINE_AA, 0) cv2.putText(img4, text2, (10, 60), font, 0.5, (0, 255, 0), 1, cv2.LINE_AA, 0) cv2.putText(img4, text3, (10, 90), font, 0.5, (0, 255, 0), 1, cv2.LINE_AA, 0) # 直线拟合 img5 = img.copy() rows, cols = img.shape[:2] [vx, vy, x, y] = cv2.fitLine(cnt, cv2.DIST_L2, 0, 0.01, 0.01) slope = -float(vy)/float(vx) # 直线斜率 lefty = int((x*slope) + y) righty = int(((x-cols)*slope)+y) cv2.line(img5, (cols-1, righty), (0, lefty), (0, 255, 0), 2) text1 = 'Center: (' + str(int(x)) + ', ' + str(int(y)) + ') ' text2 = 'Slope: ' + str(round(slope, 2)) cv2.putText(img5, text1, (10, 30), font, 0.5, (0, 255, 0), 1, cv2.LINE_AA, 0) cv2.putText(img5, text2, (10, 60), font, 0.5, (0, 255, 0), 1, cv2.LINE_AA, 0) plt.subplot(231), plt.imshow(cv2.cvtColor(img0, cv2.COLOR_BGR2RGB)), plt.title('Pole') plt.subplot(232), plt.imshow(cv2.cvtColor(img1, cv2.COLOR_BGR2RGB)), plt.title('Rectangle') plt.subplot(233), plt.imshow(cv2.cvtColor(img2, cv2.COLOR_BGR2RGB)), plt.title('Rectangle') plt.subplot(234), plt.imshow(cv2.cvtColor(img3, cv2.COLOR_BGR2RGB)), plt.title('Circle') plt.subplot(235), plt.imshow(cv2.cvtColor(img4, cv2.COLOR_BGR2RGB)), plt.title('Ellipse') plt.subplot(236), plt.imshow(cv2.cvtColor(img5, cv2.COLOR_BGR2RGB)), plt.title('Line') plt.show()