使用Python进行数据关联分析
关联分析
选择函数包
关联分析属于数据挖掘的一大类。我发现的python语言实现的包有两个:
- pymining:根据Apriori算法进行关联规则挖掘
- Orange3的关联规则库:根据FP-growth算法进行关联规则挖掘
经过分析,我决定使用Oranges进行关联规则的实现,原因如下:
FP-growth算法比Apriori算法时间复杂度低Orange3是一整套数据挖掘工具包,学习后可以熟悉相关操作,进行其他的数据挖掘算法的研究pymining不再维护,Orange3仍然是一个非常活跃的包,更新频繁Orange3实现的结果比较多,除了规则外,还能够计算出评价结果的相关数据
注意:
Orange3的关联分析模块安装时需要在Anaconda的命令行窗口中输入以下命令pip install orange3-associate
数据输入
对于使用函数包来说,我们不用管函数实现的方法,只有研究数据输入的格式即可。
Orange3的关联规则输入支持两种形式:
- 布尔类型
- 字符串类型
对于布尔类型
每一个行向量代表一个属性是否存在的数据结构
>>> X
array([[False,  True, ...,  True, False],
       [False,  True, ...,  True, False],
       [ True, False, ..., False, False],
       ...,
       [False,  True, ...,  True, False],
       [ True, False, ..., False, False],
       [ True, False, ..., False, False]], dtype=bool)
比如上面的数据X,注意这个array(属于numpy里面的多维数组)。类型一定是bool才行。
这个二维数组每一个行的维度都是一样的,这样得到的规则结果就是纯粹数组直接的关联
规则,我们要自己讲对于规则的数字和属性名称对于起来。
比如结果可能是这样:
>>> rules
    [(frozenset({17, 2, 19, 20, 7}), frozenset({41}), 41, 1.0),
     (frozenset({17, 2, 19, 7}), frozenset({41}), 41, 1.0),
     ...
     (frozenset({20, 7}), frozenset({41}), 41, 1.0),
     (frozenset({7}), frozenset({41}), 41, 1.0)]
对于字符串类型
这里我们输入就不要求每个数据的维度相同了,我们仅仅把出现的属性字符给输入进去即可。
比如下面的例子,我把上次爬虫得到的数据
进行关联规则分析。
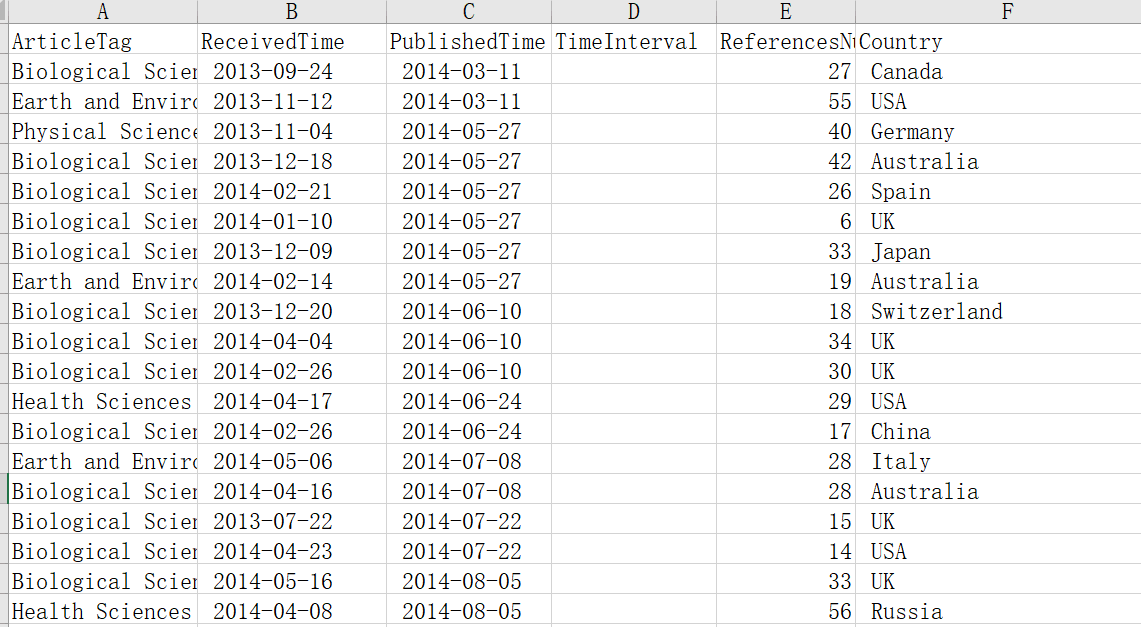
输入数据的excel表格为NS_new.xls,表格内容截图如下:
我们可以看到,我们一共有ArticleTag、ReceivedTime、PublishedTime、TimeInterval、ReferencesNum、Country这
6个属性。其中TimeInterval属性为空,用来填写PublishedTime和ReceivedTime属性之间的时间差的数据。因为我们想要分析
时间差和其他属性之间的关联关系,而不是“接收时间”与“发表时间”与其他属性之间的关联关系。
时间差需要操作两个列属性,而且两个列属性之间的减法是时间日期相关的操作,涉及到每个月份不一样,最好能之间调用系统的函数。
这样就需要自己考虑年月之间的详细变化了,下面之间使用Datafram里面的apply函数进行列的操作,具体apply函数的总结放到明天。
import pandas as pd
import datetime   #用来计算日期差的包
import orangecontrib.associate.fpgrowth as oaf  #进行关联规则分析的包

def getInterval(arrLike):  #用来计算日期间隔天数的调用的函数
    PublishedTime = arrLike['PublishedTime']
    ReceivedTime = arrLike['ReceivedTime']
#    print(PublishedTime.strip(),ReceivedTime.strip())
    days = dataInterval(PublishedTime.strip(),ReceivedTime.strip())  #注意去掉两端空白
    return days

if __name__ == '__main__':
    fileName = "NS_new.xls";
    df = pd.read_excel(fileName)
    df['TimeInterval'] = df.apply(getInterval , axis = 1)
计算完成后,所有需要分析的数据都在df里面了。
对输入数据进行编码
有了数据之后,我们先要对原始数据进行编码。
ArticleTag属性,其本身的字符串就可代表对应的类别,因此不用处理。
ReceivedTime、PublishedTime属性是生产TimeInterval属性值得因此,不用处理。
TimeInterval属性根据具体计算结果确定,经过观察,使用如下规则:
- 超过三百天为:
TimeInterval_300, - 二百到三百天为:
TimeInterval_200_300 - 一百到二百天为:
TimeInterval_100_200 - 零到一百天为:
TimeInterval_0_100
ReferencesNum的编码和TimeInterval类似。
Country直接使用国家字符串即可。
我们需要将数据放入到一个列表中用来分析,每个列表的一行代表一个数据输出的项目,设该列表名字是listToAnalysis,
则生成该列表的代码如下:
listToAnalysis = []
    listToStore = []
    for i in range(df.iloc[:,0].size):             #df.iloc[:,0].size
        #处理ArticleTag段位
        s = df.iloc[i]['ArticleTag']
        #s = re.sub('\s','_',s.split('/')[1].strip())
        s = s.strip()
        s = 'ArticleTag_'+s
        listToStore.append(s)
        #处理TimeInterval段位
        s = df.iloc[i]['TimeInterval']
        if s > 300:
            s = 'TimeInterval_'+'300'
        elif s > 200 and s <= 300:
            s = 'TimeInterval_'+'200_300'
        elif s > 100 and s <= 200:
            s = 'TimeInterval_'+'100_200'
        elif s <= 100:
            s = 'TimeInterval_'+'0_100'
        listToStore.append(s)
        #处理ReferencesNumber段位
        s = df.iloc[i]['ReferencesNumber']
        if s > 80:
            s = 'ReferencesNumber'+'80'
        elif s > 60 and s <= 80:
            s = 'ReferencesNumber'+'60_80'
        elif s > 40 and s <= 60:
            s = 'ReferencesNumber'+'40_60'
        elif s > 20 and s <= 40:
            s = 'ReferencesNumber'+'20_40'
        elif s > 0 and s <= 20:
            s = 'ReferencesNumber'+'0_20'
        listToStore.append(s)
        #处理Country段位
        s = df.iloc[i]['Country']
        s = 'Country_'+s.strip()
        listToStore.append(s)
        #print(listToStore)
        listToAnalysis.append(listToStore.copy())
        listToStore.clear()
使用关联相关的函数进行数据处理
将输入数据的格式完成之后,就可以使用关联规则函数进行数据挖掘了。
进入函数说明文档页面
首先看第一个函数fpgrowth.frequent_itemsets(X, min_support=0.2)
这个函数代表计算给定支持度下得到的频繁项集,返回的是一个频繁项集的列表生成器。
- X代表输入的数组类型的数据(list or numpy.ndarray or scipy.sparse.spmatrix or iterator))
- min_support代表关联规则设置的置信度,默认为0.2
注意:该函数返回的列表生成器只能使用一次,我在这里调试时出了好多次错误,每次用完后我调用这个生成器,
然后总是得到空集,所以干脆直接返回值包上字典函数dict并返回给变量itemsets,这样可以多次使用
由于输入必须是整数,因此这里需要把所有字符串进行编码:
#进行编码,将listToAnalysis里面的字符串转换成整数
strSet = set(functools.reduce(lambda a,b:a+b, listToAnalysis))
strEncode = dict(zip(strSet,range(len(strSet)))) #编码字典,即:{'ArticleTag_BS': 6,'Country_Argentina': 53,etc...}
strDecode = dict(zip(strEncode.values(), strEncode.keys()))  #解码字典,即:{6:'ArticleTag_BS',53:'Country_Argentina',etc...}
listToAnalysis_int = [list(map(lambda item:strEncode[item],row)) for row in listToAnalysis]   #编码后的输入数据
预处理做好了,这里分析仅仅一行代码即可:
itemsets = dict(oaf.frequent_itemsets(listToAnalysis_int , .02)) #这里设置支持度
返回的itemsets就是频繁项集,这时可以调用第二个函数fpgrowth.association_rules(itemsets, min_confidence, itemset=None)
这个函数代表在给定置信度和第一步得到的频繁项集的情况下得到关联规则
- itemsets代表第一个函数返回的字典数据集
- min_confidence代表关联规则设置的支持度
- itemset代表仅仅生成该频繁项集下的规则,这个项集必须是itemsets这个字典里的一个键,数据结构格式是
frozenset,例如frozenset({6})
注意:该函数返回的列表生成器只能使用一次,我在这里调试时出了好多次错误,每次用完后我调用这个生成器,
然后总是得到空集,所以干脆直接返回值包上列表函数list并返回给变量itemsets,这样可以多次使用
关联规则生成仅仅两行代码即可:
rules = oaf.association_rules(itemsets, .5)   #这里设置置信度
rules = list(rules)
rules的结果是元祖,每一个值都是frozenset,frozenset,suport,confidence形式,例如:
(frozenset({1, 24, 41}), frozenset({8}), 13, 0.7222222222222222)
我为了使结果更有利于观察,自己加了个函数得到可打印的便于观察的规则,代码如下:
def dealResult(rules,strDecode):
    returnRules = []
    for i in rules:
        temStr = '';
        for j in i[0]:   #处理第一个frozenset
            temStr = temStr+strDecode[j]+'&'
        temStr = temStr[:-1]
        temStr = temStr + ' ==> '
        for j in i[1]:
            temStr = temStr+strDecode[j]+'&'
        temStr = temStr[:-1]
        temStr = temStr + ';' +'\t'+str(i[2])+ ';' +'\t'+str(i[3])+ ';' +'\t'+str(i[4])+ ';' +'\t'+str(i[5])+ ';' +'\t'+str(i[6])+ ';' +'\t'+str(i[7])
#        print(temStr)
        returnRules.append(temStr)
    return returnRules

printRules = dealRules(rules,strDecode)
这里可以打印printRules观察结果
返回的规则rules就是规则列表,即可调用第三个函数fpgrowth.rules_stats(rules, itemsets, n_examples)
这个函数代表在给规则列表和频繁项集和总样例数目的情况下得到关联规则相关评价结果
- rules代表第二个函数得到的规则列表
- itemsets代表第一个函数返回的字典数据集
- n_examples代表实例的总数
代码如下:
result = list(oaf.rules_stats(rules, itemsets, len(listToAnalysis))) #下面这个函数改变了rules和itemsets,把rules和itemsets置空!
注意,使用完第三个函数后,输入的itemsetes和rules都空了!
为了使得结果便于观察和保存,我最近实现了一个函数,将结果清晰的写到一个excel表格里面,代码如下:
def ResultDFToSave(rules):   #根据Qrange3关联分析生成的规则得到并返回对于的DataFrame数据结构的函数
    returnRules = []
    for i in rules:
        temList = []
        temStr = '';
        for j in i[0]:   #处理第一个frozenset
            temStr = temStr + str(j) + '&'
        temStr = temStr[:-1]
        temStr = temStr + ' ==> '
        for j in i[1]:
            temStr = temStr + str(j) + '&'
        temStr = temStr[:-1]
        temList.append(temStr); temList.append(i[2]); temList.append(i[3]); temList.append(i[4])
        temList.append(i[5]); temList.append(i[6]); temList.append(i[7])
        returnRules.append(temList)
    return pd.DataFrame(returnRules,columns=('规则','项集出现数目','置信度','覆盖度','力度','提升度','利用度'))


dfToSave = ResultDFToSave(result)
dfToSave.to_excel('regular.xlsx')
置信度和支持度的选择
置信度和支持度一般都是根据几个数据得到的规则数目自己选择的,我编写了一个程序,可以得到不同置信度和支持度下生成规则的数目,
用来决定具体选择多少,代码如下:
#######################################################下面是根据不同置信度和关联度得到关联规则数目
    listTable = []
    supportRate = 0.1
    confidenceRate = 0.1
    for i in range(9):
        support = supportRate*(i+1)
        listS = []
        for j in range(9):
            confidence = confidenceRate*(j+1)
            itemsets = dict(oaf.frequent_itemsets(listToAnalysis, support))
            rules = list(oaf.association_rules(itemsets, confidence))
            listS.append(len(rules))
        listTable.append(listS)
    dfList = pd.DataFrame(listTable,index = [supportRate*(i+1) for i in range(9)],columns=[confidenceRate*(i+1) for i in range(9)])
    dfList.to_excel('regularNum.xlsx')
最后,本篇的全部代码在下面这个网页可以下载:
https://github.com/Dongzhixiao/Python_Exercise/tree/master/associate
2019-6-24: 修改数据预处理,即将输入数据的字符串编码为整数,然后再进行关联规则计算
