python学习之柱状图
需求背景
最近需要分析数据,之前画过折线图,这一次需要画柱状图。做项目的同时学习一点其他的小技能。
现在需要将固定格式的数据,画成柱状图,将同一个点的数据,求出最大值,和最小值使用柱状图显示出来。
实际的数据
 test_down_id:1061, y:5
test_down_id:1061, y:5
test_down_id:1061, y:5
test_down_id:1062, y:-2
test_down_id:1062, y:-3
test_down_id:1062, y:-3
test_down_id:1062, y:-4
test_down_id:1063, y:6
test_down_id:1063, y:8
画柱状图还是很简单的,使用plt的bar属性就可以了。需要注意的是,怎样显示柱状图上的数字,这个是需要使用plt.txt属性显示的,单独使用bar没法显示出来
代码
import numpy as np
import matplotlib as mpl
import matplotlib.pyplot as plt
import mpl_toolkits.mplot3d
import sys
import io
tag_cnt = 50
tag_list = []
tag_list_print = [0 for x in range(0, tag_cnt)]
max_list = [0 for x in range(0, tag_cnt)]
min_list = [0 for x in range(0, tag_cnt)]
f = io.open(sys.argv[1],'r',encoding='utf-8')
# find the every id max value
while 1:
line = f.readline()
if not line:
break;
value1 = line.split(",", 1)[0]
tag = int(value1.split(":", 1)[1])
value2 = line.split(",", 1)[1]
y = int(value2.split(":", 1)[1])
#find the max value
if ( y >= 0) :
if(1 == tag_list.count(tag)) :
pos = tag_list.index(tag)
if (pos >= tag_cnt) :
break;
if (y > max_list[pos]) :
max_list[pos] = y
else :
tag_list.append(tag)
pos = tag_list.index(tag)
if (pos >= tag_cnt) :
break;
max_list[pos] = y
#find min value
if ( y < 0) :
if(1 == tag_list.count(tag)) :
pos = tag_list.index(tag)
if (pos >= tag_cnt) :
break;
if (y < min_list[pos]) :
min_list[pos] = y
else :
tag_list.append(tag)
pos = tag_list.index(tag)
if (pos >= tag_cnt) :
break;
min_list[pos] = y
# the num of x and y must be the same
for i in range(len(tag_list)):
tag_list_print[i] = tag_list[i];
tag_list_print2 = tag_list_print
print("min_list", len(min_list))
print(min_list)
print("max_list", len(max_list))
print(max_list)
print("print_list", len(tag_list_print))
print(tag_list_print)
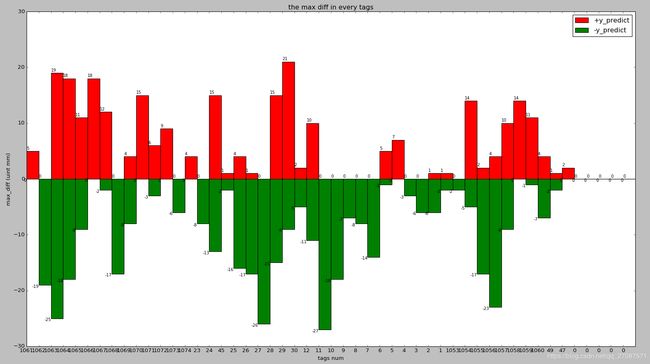
plt.title("the max diff in every tags")
plt.ylabel("max_diff (uint mm)")
plt.xlabel("tags num")
# param :x_list, y_list , width, x_show, color,plt.bar(range(tag_cnt), max_list, width = 1, tick_label=tag_list_print, facecolor='red' ,label = '+y_predict')
plt.bar(range(tag_cnt), max_list, width = 1, tick_label=tag_list_print, facecolor='red' ,label = '+y_predict')
plt.bar(range(tag_cnt), min_list, width = 1, tick_label=tag_list_print, facecolor='green', label = '-y_predict')
for xx, yy in zip(range(tag_cnt), max_list):
plt.text(xx, yy+0.1, str(yy), ha = "left", va = 'bottom', fontsize = 9)
for xx, yy in zip(range(tag_cnt), min_list):
plt.text(xx, yy+0.1, str(yy), ha = "right", va = 'top', fontsize = 9)
plt.legend()
plt.show()
显示效果如下: