二手房房价影响因素分析
数据探索,数据预处理,数据可视化
观察数据分布,处理异常值,缺失值
# coding: utf-8
"""
dist-所在区
roomnum-室的数量
halls-厅的数量
AREA-房屋面积
floor-楼层
subway-是否临近地铁
school-是否学区房
price-平米单价
"""
import pandas as pd
import numpy as np
import math
import matplotlib.pyplot as plt
import matplotlib
import seaborn as sns
import statsmodels.api as sm
from numpy import corrcoef,array
#from IPython.display import HTML, display
from statsmodels.formula.api import ols
import os
matplotlib.rcParams['axes.unicode_minus']=False#解决保存图像时负号'-'显示为方块的问题
plt.rcParams['font.sans-serif'] = ['SimHei']#指定默认字体
os.chdir(r"H:\2019-2-3新华书店笔记以及资料\资料\第四讲作业-二手房房价影响因素分析")
datall=pd.read_csv("sndHsPr.csv")
print(datall.shape)  #样本量
(16210, 8)dat0.drop_duplicates(inplace=True)
dat0=datall.copy()
dat0.describe(include="all").T #查看数据基本描述
| count | unique | top | freq | mean | std | min | 25% | 50% | 75% | max | |
|---|---|---|---|---|---|---|---|---|---|---|---|
| dist | 16210 | 6 | fengtai | 2947 | NaN | NaN | NaN | NaN | NaN | NaN | NaN |
| roomnum | 16210 | NaN | NaN | NaN | 2.16619 | 0.809907 | 1 | 2 | 2 | 3 | 5 |
| halls | 16210 | NaN | NaN | NaN | 1.22141 | 0.532048 | 0 | 1 | 1 | 2 | 3 |
| AREA | 16210 | NaN | NaN | NaN | 91.7466 | 44.0008 | 30.06 | 60 | 78.83 | 110.517 | 299 |
| floor | 16210 | 3 | middle | 5580 | NaN | NaN | NaN | NaN | NaN | NaN | NaN |
| subway | 16210 | NaN | NaN | NaN | 0.827822 | 0.377546 | 0 | 1 | 1 | 1 | 1 |
| school | 16210 | NaN | NaN | NaN | 0.303085 | 0.459606 | 0 | 0 | 0 | 1 | 1 |
| price | 16210 | NaN | NaN | NaN | 61151.8 | 22293.4 | 18348 | 42812.2 | 57473 | 76099.8 | 149871 |
得出此数据并无缺失值(若缺失值,可以用均值,众数,平均数替换,具体情况看分布),稍后只需对异常值进行调整
dat0.price=dat0.price/10000  #价格单位转换成万元
#将城区的水平由拼音改成中文,以便作图输出美观
dict1 = {
        u'chaoyang' : "朝阳",
        u'dongcheng' : "东城",
        u'fengtai' :  "丰台",
        u'haidian' : "海淀",
        u'shijingshan' : "石景山",
        u'xicheng': "西城"
        }
dat0.dist = dat0.dist.apply(lambda x : dict1[x])
dat0.head()| dist | roomnum | halls | AREA | floor | subway | school | price | |
|---|---|---|---|---|---|---|---|---|
| 0 | 朝阳 | 1 | 0 | 46.06 | middle | 1 | 0 | 4.8850 |
| 1 | 朝阳 | 1 | 1 | 59.09 | middle | 1 | 0 | 4.6540 |
| 2 | 海淀 | 5 | 2 | 278.95 | high | 1 | 1 | 7.1662 |
| 3 | 海淀 | 3 | 2 | 207.00 | high | 1 | 1 | 5.7972 |
| 4 | 丰台 | 2 | 1 | 53.32 | low | 1 | 1 | 7.1268 |
#频次统计

dat0.dist.value_counts().plot(kind = 'pie')   #绘制柱柱形图

dat0.dist.agg(['value_counts'])

#dat0.dist.value_counts()| value_counts | |
|---|---|
| 丰台 | 2947 |
| 海淀 | 2919 |
| 朝阳 | 2864 |
| 东城 | 2783 |
| 西城 | 2750 |
| 石景山 | 1947 |
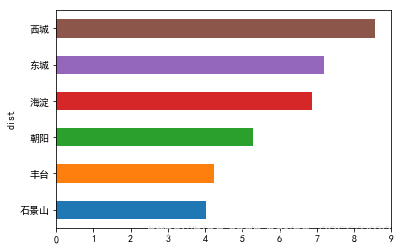
dat0.price.groupby(dat0.dist).mean().sort_values(ascending= True).plot(kind = 'barh') #不同城区的单位房价面积均值情况dat1=dat0[['dist','price']]
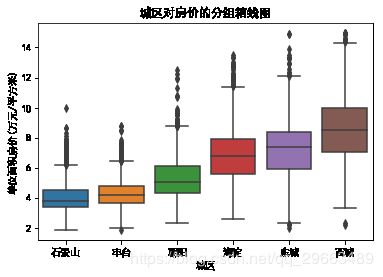
dat1.dist=dat1.dist.astype("category")# 区域变成分类变量
dat1.dist.cat.set_categories(["石景山","丰台","朝阳","海淀","东城","西城"],inplace=True)#分类变量的顺序
#dat1.sort_values(by=['dist'],inplace=True)
sns.boxplot(x='dist',y='price',data=dat1)
#dat1.boxplot(by='dist',patch_artist=True)
plt.ylabel("单位面积房价(万元/平方米)")
plt.xlabel("城区")
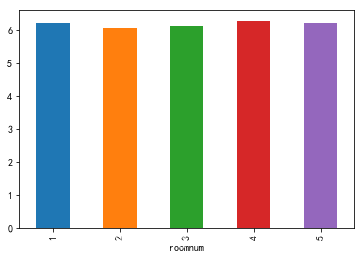
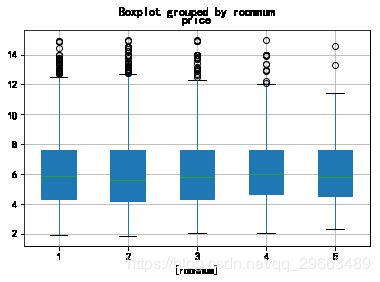
plt.title("城区对房价的分组箱线图")#不同卧室数的单位面积房价差异不大
dat4=dat0[['roomnum','price']]
dat4.price.groupby(dat4.roomnum).mean().plot(kind='bar')
dat4.boxplot(by='roomnum',patch_artist=True)#厅数对单位面积房价有轻微影响
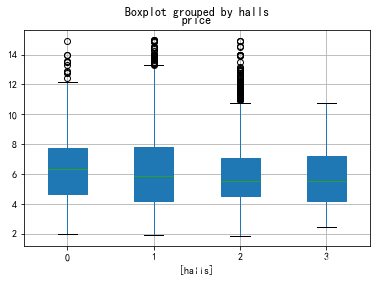
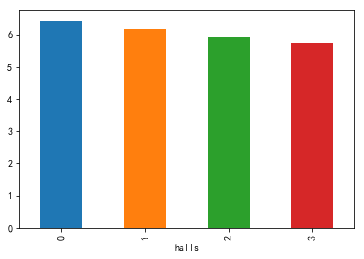
dat5=dat0[['halls','price']]
dat5.price.groupby(dat5.halls).mean().plot(kind='bar')
dat5.boxplot(by='halls',patch_artist=True)#不同楼层的单位面积房价差异不明显
dat6=dat0[['floor','price']]
dat6.price.groupby(dat5.halls).mean().plot(kind='bar')
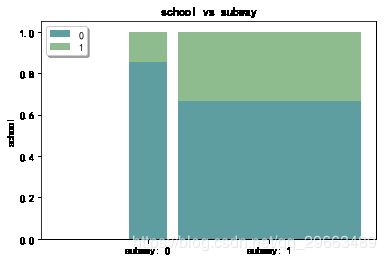
dat6.boxplot(by='floor',patch_artist=True)#地铁和学区房的数量以及比例关系
print(pd.crosstab(dat0.subway,dat0.school))
sub_sch=pd.crosstab(dat0.subway,dat0.school)
sub_sch = sub_sch.div(sub_sch.sum(1),axis = 0)
sub_schschool 0 1 subway 0 2378 413 1 8919 4500
| school | 0 | 1 |
|---|---|---|
| subway | ||
| 0 | 0.852024 | 0.147976 |
| 1 | 0.664655 | 0.335345 |
def stack2dim(raw, i, j, rotation = 0, location = 'upper left'):
    '''
    此函数是为了画两个维度标准化的堆积柱状图
    要求是目标变量j是二分类的
    raw为pandas的DataFrame数据框
    i、j为两个分类变量的变量名称,要求带引号,比如"school"
    rotation:水平标签旋转角度,默认水平方向,如标签过长,可设置一定角度,比如设置rotation = 40
    location:分类标签的位置,如果被主体图形挡住,可更改为'upper left'
    '''
    import math
    data_raw = pd.crosstab(raw[i], raw[j])
    data = data_raw.div(data_raw.sum(1), axis=0)  # 交叉表转换成比率,为得到标准化堆积柱状图

    # 计算x坐标,及bar宽度
    createVar = locals()
    x = [0] #每个bar的中心x轴坐标
    width = [] #bar的宽度
    k = 0
    for n in range(len(data)):
        # 根据频数计算每一列bar的宽度
        createVar['width' + str(n)] = data_raw.sum(axis=1)[n] / sum(data_raw.sum(axis=1))
        width.append(createVar['width' + str(n)])
        if n == 0:
            continue
        else:
            k += createVar['width' + str(n - 1)] / 2 + createVar['width' + str(n)] / 2 + 0.05
            x.append(k)

    # 以下是通过频率交叉表矩阵生成一列对应堆积图每一块位置数据的数组,再把数组转化为矩阵
    y_mat = []
    n = 0
    for p in range(data.shape[0]):
        for q in range(data.shape[1]):
            n += 1
            y_mat.append(data.iloc[p, q])
            if n == data.shape[0] * 2:
                break
            elif n % 2 == 1:
                y_mat.extend([0] * (len(data) - 1))
            elif n % 2 == 0:
                y_mat.extend([0] * len(data))

    y_mat = np.array(y_mat).reshape(len(data) * 2, len(data))
    y_mat = pd.DataFrame(y_mat)  # bar图中的y变量矩阵,每一行是一个y变量

    # 通过x,y_mat中的每一行y,依次绘制每一块堆积图中的每一块图
    createVar = locals()
    for row in range(len(y_mat)):
        createVar['a' + str(row)] = y_mat.iloc[row, :]
        if row % 2 == 0:
            if math.floor(row / 2) == 0:
                label = data.columns.name + ': ' + str(data.columns[row])
                plt.bar(x, createVar['a' + str(row)],
                        width=width[math.floor(row / 2)], label='0', color='#5F9EA0')
            else:
                plt.bar(x, createVar['a' + str(row)],
                        width=width[math.floor(row / 2)], color='#5F9EA0')
        elif row % 2 == 1:
            if math.floor(row / 2) == 0:
                label = data.columns.name + ': ' + str(data.columns[row])
                plt.bar(x, createVar['a' + str(row)], bottom=createVar['a' + str(row - 1)],
                        width=width[math.floor(row / 2)], label='1', color='#8FBC8F')
            else:
                plt.bar(x, createVar['a' + str(row)], bottom=createVar['a' + str(row - 1)],
                        width=width[math.floor(row / 2)], color='#8FBC8F')

    plt.title(j + ' vs ' + i)
    group_labels = [data.index.name + ': ' + str(name) for name in data.index]
    plt.xticks(x, group_labels, rotation = rotation)
    plt.ylabel(j)
    plt.legend(shadow=True, loc=location)
    plt.show()
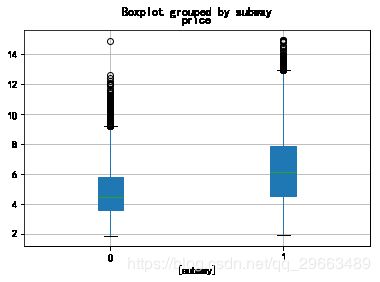
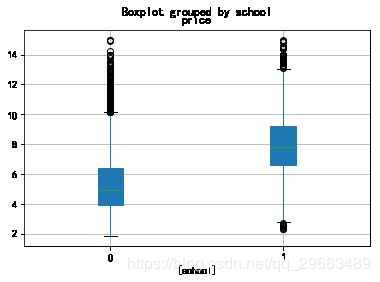
stack2dim(dat0, i="subway", j="school")#地铁、学区的分组箱线图
dat2=dat0[['subway','price']]
dat3=dat0[['school','price']]
dat2.boxplot(by='subway',patch_artist=True)
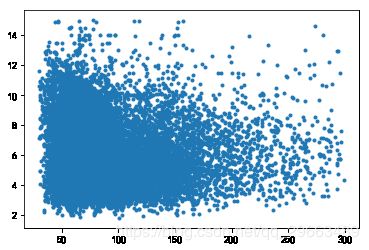
dat3.boxplot(by='school',patch_artist=True)#面积和房价的相关关系
datA=dat0[['AREA','price']]
plt.scatter(datA.AREA,datA.price,marker='.')#求AREA和price的相关系数矩阵
data1=array(datA['price'])
data2=array(datA['AREA'])
datB=array([data1,data2])
corrcoef(datB)array([[ 1. , -0.07395475],
[-0.07395475, 1. ]])
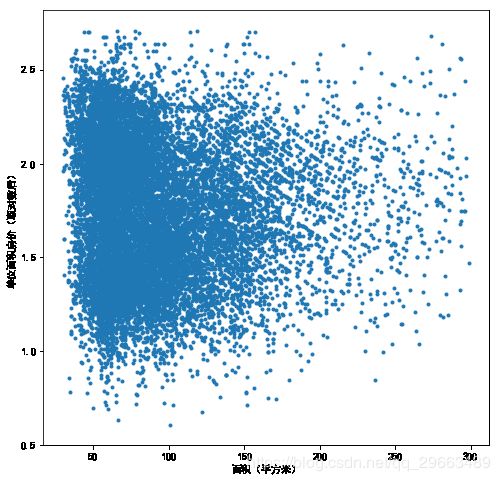
#看到从左至右逐渐稀疏的散点图,第一反应是对Y取对数(还可以根号,倒数等)
#房屋面积和单位面积房价(取对数后)的散点图
datA['price_ln'] = np.log(datA['price'])  #对price取对数
plt.figure(figsize=(8,8))
plt.scatter(datA.AREA,datA.price_ln,marker='.')
plt.ylabel("单位面积房价(取对数后)")
plt.xlabel("面积(平方米)")
#求AREA和price_ln的相关系数矩阵
data1=array(datA['price_ln'])
data2=array(datA['AREA'])
datB=array([data1,data2])
corrcoef(datB)array([[ 1. , -0.05811827],
[-0.05811827, 1. ]])
相关系数较低,之后可以交给模型来判断相关程度
数据建模
#建模之前,数据去重,将特征转换,将地区,楼层转换为特征
dat0.dist.unique()
dat0.floor=dat0.floor.apply(lambda x:1 if  x=='low' else (2 if x=='middle' else(3)))
dist_dumm=pd.get_dummies(dat0.dist)
dat0=pd.concat([dat0,dist_dumm],axis=1)
dat0.drop(['dist'],axis=1,inplace=True)
features=dat0.iloc[:,:-1].copy()
prices=dat0.price.copy()
f_train,f_test,p_train,p_test=train_test_split(features, prices,test_size=0.2, random_state=0)
先使用较为简单的线性回归,使用预测值和测试集的值比较,以标准差来判断模型优劣
#线性回归
from sklearn.model_selection import train_test_split
from sklearn.linear_model import LinearRegression
lineR = LinearRegression()
lineR.fit(f_train,p_train)
y_pred = lineR.predict(f_test)
print(lineR.coef_, lineR.intercept_)#打印出模型的参数
[[-1.01571866e-16 -1.40658969e-15 -2.85145171e-17 -1.36369393e-17 7.15942502e-16 5.95711390e-16 -2.41642525e-16 -1.42857143e-01 -1.42857143e-01 -1.42857143e-01 -1.42857143e-01 -1.42857143e-01 7.14285714e-01 -1.42857143e-01 -1.42857143e-01 -1.42857143e-01 -1.42857143e-01 -1.42857143e-01]] [0.28571429]
#评价
#(1) 评价测度
# 对于分类问题,评价测度是准确率,但这种方法不适用于回归问题。我们使用针对连续数值的评价测度(evaluation metrics)。
# 这里介绍3种常用的针对线性回归的测度。
# 1)平均绝对误差(Mean Absolute Error, MAE)
# (2)均方误差(Mean Squared Error, MSE)
# (3)均方根误差(Root Mean Squared Error, RMSE)
# 这里我使用RMSE。
sum_mean=0
for i in range(len(p_test)):
    sum_mean+=(y_pred[i]-p_test.values[i])**2
sum_erro=np.sqrt(sum_mean/len(p_test))
# calculate RMSE by hand
print ("RMSE by hand:",sum_erro)
RMSE by hand: [6.28699327]
#多项式回归
from sklearn.preprocessing import PolynomialFeatures
poly = PolynomialFeatures(degree=3)
x_poly = poly.fit_transform(f_train)
lrp = LinearRegression()
lrp.fit(x_poly, p_train)
y_poly_pred = lrp.predict(x_poly)
sum_mean=0
for i in range(len(p_test)):
sum_mean+=(y_poly_pred[i]-p_test.values[i])**2
sum_erro=np.sqrt(sum_mean/len(p_test))
# calculate RMSE by hand
print ("RMSE by hand:",sum_erro)RMSE by hand: 3.156191349597294
明显看到多项式回归得到的均方根误差减小了
#岭回归
from sklearn.linear_model import Ridge #加载岭回归方法
clf = Ridge(alpha=1.0, fit_intercept=True) #创建岭回归实例
clf.fit(f_train, p_train) #调用fit函数使用训练集训练回归器
score = clf.score(f_test, p_test)
c_test=clf.predict(f_test)
sum_mean=0
for i in range(len(p_test)):
sum_mean+=(c_test[i]-p_test.values[i])**2
sum_erro=np.sqrt(sum_mean/len(p_test))
# calculate RMSE by hand
print ("RMSE by hand:",sum_erro)RMSE by hand: 5.313616011775014e-05
岭回归得到的均方根误差比上面2种模型的更小,得出最优模型

