Python视频学习(二十二、数据分析基础(上) matplotlib + numpy)
目录
- 0 介绍
- ★Conda使用
- 1. matplotlib折线图
- 1.1 设置图片大小和清晰度
- 1.2 保存到本地
- 1.3 添加图片的描述信息 —— xlabel, ylabel, title
- 1.4 调整x或者y的刻度 —— xticks, yticks
- 1.5 —— 输出中文
- a. matplotlib.rc
- b. ★matplotlib.font_manager
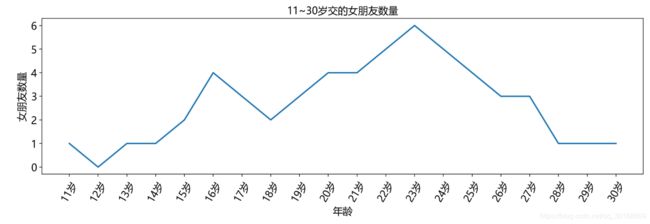
- 案例 —— 交女朋友数量
- 1.6 画网格 —— grid
- 1.7 图例 —— legend
- 案例 —— 2人交女朋友数量
- 1.8 ★线条的样式
- 案例
- 1.9 标记特殊的点
- 1.10 给图片添加水印
- 小结
- 3. matplotlib 画其他图
- 3.1 散点图
- 案例 —— 绘制3月和10月所有气温的散点图
- 3.2 条形图
- a. 正常条形图 —— plt.bar
- b. 垂直条形图 —— plt.barh
- 案例 —— 多个条形图对比票房
- 3.3 直方图 —— plt.hist
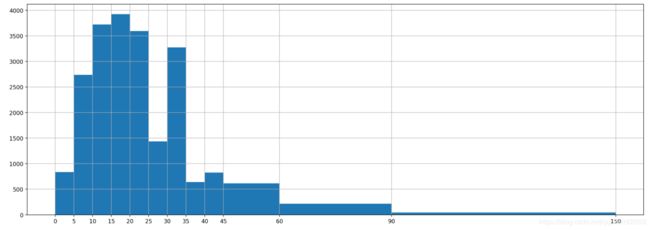
- 案例 —— 普查分布
- 3.4 其他绘图工具
- 4. numpy
- 4.1 创建数组
- 4.2 类型
- 四舍五入小数 —— np.round(数组, 小数位)
- 4.3 形状
- 4.4 计算
- ★广播
- 4.5 轴
- 4.6 numpy读取本地数据
- 4.7 转置
- 4.8 ★★索引和切片
- a. 布尔索引
- b. 值替换
- c. np中的“三元运算符" —— `np.where`
- d. `np.clip`
- 4.9 `np.nan`和 `np.inf`
- a. nan的特点
- b. 如何处理nan
- 4.10 np常用统计函数
- 案例—— 将nan替换成均值
- 4.11 数组拼接
- 4.12 行列交换
- 4.13 产生随机数
- 4.14 其他方法
- 4.15 ★numpy数组的拷贝 —— t.copy()
0 介绍
学习内容(这些学习6天):
- 基础概念和环境
- matplotlib
- numpy
- pandas
为什么学习数据分析:
- 岗位需求 —— web/爬虫 + 数据分析+ 机器学习
- 是机器学习的基础
数据分析的流程:
- 提出问题
- 准备数据
- 分析数据
- 获得结论
- 可视化
★Conda使用
Conda可以既可以管理Python环境,也可以管理Python的包,如果pip安装东西安装不上的话,使用conda安装,八成能装上。
conda是主要命令,使用它能够:
- Query and search the Anaconda package index and current Anaconda installation.
- Create new conda environments.
- Install and update packages into existing conda environments.
| 常用命令 | |
|---|---|
conda --version |
查看conda的版本 |
conda info |
查看当前conda信息 |
conda update conda |
更新包(这里是更新conda) |
conda create -n myenv python=3.4 scipy=0.15.0 astroid babel |
创建环境,指定版本 |
| 环境管理 | |
|---|---|
conda create --name snowflakes biopython |
创建一个新的环境叫做snowflakes, 同时安装biopython包 |
conda create --name snakes python=3.5 |
创建新环境snakes, 指定python版本 |
windows: activate 环境名 Linux/Mac: source activate 环境名 |
激活虚拟环境 |
windows: deactivate 环境名 Linux/Mac: source deactivate 环境名 |
退出虚拟环境 |
conda info --envs |
查看虚拟环境 |
conda env list |
查看虚拟环境 |
conda create --name myclone --clone myenv |
克隆myenv创建一个新的 myclone环境 |
| 包管理 | |
|---|---|
conda search beautifulsoup4 |
查看是否库中有这没有这个package |
conda install beautifulsoup4 |
安装pacage |
conda list |
查看当前环境下的所有包 |
conda list -e > requirements.txt |
|
conda create --name myenv --file requirements.txt |
从requirements.txt 创建环境 |
1. matplotlib折线图
知识点:
- 基本要点
- 散点图、直方图、柱状图
- 更多的绘图工具
from matplotlib import pyplot as plt
x = range(2,26,2)
y = [15,13,14,5,17,20,25,26,24,22,18,15]
# x和y都是可迭代对象
plt.plot(x,y)
plt.show()
还可以完善:
1.1 设置图片大小和清晰度
# plot之前设置
fig = plt.figure(figsize=(20,8),dpi=80)
1.2 保存到本地
# 画图之后调用
plt.savefig("路径文件名")
plt.savefig("a.png")
plt.savefig("a.svg") #保存为矢量图
1.3 添加图片的描述信息 —— xlabel, ylabel, title
plt.xlabel("时间", fontproperties=f)  # 添加x轴的描述信息
plt.ylabel("温度"fontproperties=f)
plt.title("10点到12点每分钟的气温变化",fontproperties=f)
1.4 调整x或者y的刻度 —— xticks, yticks
plt.xticks([1,2,3,4,5]) # 把x中所有值画成x的坐标刻度, x必须是 全数字,才会一一对应
plt.xticks(range(2,25))

plt.xticks(x, xlabels)  # 显示字符串,会把xlabels中的内容和x的数值对应,然后显示 label的文字

plt.xticks(x,xlabels, rotation) # rotation指定文字旋转角度, 90就是垂直方向
1.5 —— 输出中文
matplotlib默认不支持中文
a. matplotlib.rc
windows/linux 下使用
查看源代码学习
# 10点到12点的每一分钟的气温
from matplotlib import pyplot as plt
from matplotlib import font_manager
import matplotlib
import random
a= [random.randint(20,35) for i in range(120)]

# 1. 设置中文
font = {'family' : 'simhei',
              'weight' : 'bold'}

matplotlib.rc('font', **font)

# 2. 设置图形大小
plt.figure(figsize=(20,8), dpi=200)

# 3. 设置水平轴的名字
x_labels = [ f"{i//60+10}时{i%60}分" for i in range(120)]
plt.xticks(range(0,120,10), x_labels[::10], rotation=60)

plt.plot(range(120),a)
plt.show()
b. ★matplotlib.font_manager
- 使用
font_manager.FontProperties - 传入字体文件的路径,来实例化字体
- 在调用方法的时候将其传入给
fontproperties或者prop(legend方法专用)
# 10点到12点的每一分钟的气温
from matplotlib import pyplot as plt
from matplotlib import font_manager
import random
a= [random.randint(20,35) for i in range(120)]

# 1. 设置图形大小
plt.figure(figsize=(20,8), dpi=200)
# 2. 设置中文和字体
font = font_manager.FontProperties(fname="C:\Windows\Fonts\MSYH.ttc", weight="bold", size=14)

# 3. 设置水平轴的名字
x_labels = [ f"{i//60+10}时{i%60}分" for i in range(120)]
plt.xticks(range(0,120,10), x_labels[::10], rotation=60, fontproperties=font)
plt.yticks(fontproperties=font)


plt.plot(range(120),a)
plt.show()
案例 —— 交女朋友数量
# 11~30岁对象的数量
from matplotlib import pyplot as plt
from matplotlib import font_manager
import random

# 1. 准备数据
_ygirls = [1,0,1,1,2,4,3,2,3,4,4,5,6,5,4,3,3,1,1,1]
_xages = range(11,31)
_xlabels = [f"{age}岁" for age in _xages]
# 2. 设置图形大小
plt.figure(figsize=(20,8), dpi=200)
# 3. 设置中文
font = font_manager.FontProperties(fname="C:\Windows\Fonts\MSYH.ttc", weight="bold", size=14)
# 4. 设置描述信息
plt.xlabel("年龄", fontproperties=font)
plt.ylabel("女朋友数量",fontproperties=font)
plt.title("11~30岁交的女朋友数量",fontproperties=font)
# 5. 设置水平轴的名字
plt.xticks( _xages, _xlabels, rotation=60, fontproperties=font)
plt.yticks(fontproperties=font)
# 6. 作图
plt.plot(_xages, _ygirls)
plt.show()
1.6 画网格 —— grid
注意: 网格是会在每个x和y轴刻度上绘制,所以要更改网格的疏密,应该去修改 轴线刻度
plt.grid()

plt.grid(alpha=0.4) # 设置网格线的透明度
plt.grid(color="r", linestyle='-', linewidth=2)
1.7 图例 —— legend
- 在plot的时候添加label参数
- 调用legend方法
- 如果有中文,给legend方法传入
prop参数
font = font_manager.FontProperties(fname="C:\Windows\Fonts\MSYH.ttc", weight="bold", size=14)

plt.plot(_xages, _y1girls,label="第一个人")
plt.plot(_xages, _y2girls,label="第二个人")

plt.legend(loc="upper left", prop=font)
-
loc参数,指定图例的位置
  |Location String  | Location Code|
  ===============   =============
  'best'            0
  'upper right'     1
  'upper left'      2
  'lower left'      3
  'lower right'     4
  'right'           5
  'center left'     6
  'center right'    7
  'lower center'    8
  'upper center'    9
  'center'          10
  ===============   =============
案例 —— 2人交女朋友数量
# 11~30岁2个人对象的数量
from matplotlib import pyplot as plt
from matplotlib import font_manager
import random

# 1. 准备数据
_y1girls = [1,0,1,1,2,4,3,2,3,4,4,5,6,5,4,3,3,1,1,1]
_y2girls = [1,0,3,1,2,2,3,3,2,1 ,2,1,1,1,1,1,1,1,1,1]
_xages = range(11,31)
_xlabels = [f"{age}岁" for age in _xages]
# 2. 设置图形大小
plt.figure(figsize=(15,4), dpi=200)
# 3. 设置中文
font = font_manager.FontProperties(fname="C:\Windows\Fonts\MSYH.ttc", weight="bold", size=14)
# 4. 设置描述信息
plt.xlabel("年龄", fontproperties=font)
plt.ylabel("女朋友数量",fontproperties=font)
plt.title("11~30岁交的女朋友数量",fontproperties=font)
# 5. 设置水平轴的名字
plt.xticks( _xages, _xlabels, rotation=60, fontproperties=font)
plt.yticks(fontproperties=font)
# 6. 作图
plt.plot(_xages, _y1girls,label="第一个人")
plt.plot(_xages, _y2girls,label="第二个人")
# 7. 图例
plt.legend(loc="upper left", prop=font)
plt.show()
1.8 ★线条的样式
plt.plot的其他参数:
- color=‘r’
- linestyle=’-’
- linewidth=5
- alpha=0.5
plt.plot的第三个参数是线的format string:
fmt = '[color][marker][line]'
Colors
    The following color abbreviations are supported:

    =============    ===============================
    character        color
    =============    ===============================
    ``'b'``          blue
    ``'g'``          green
    ``'r'``          red
    ``'c'``          cyan
    ``'m'``          magenta
    ``'y'``          yellow
    ``'k'``          black
    ``'w'``          white
    =============    ===============================
如果fmt中只有颜色设置,则颜色可以使用全名,或者16进制表示
Markers
    =============    ===============================
    character        description
    =============    ===============================
    ``'.'``          point marker
    ``','``          pixel marker
    ``'o'``          circle marker
    ``'v'``          triangle_down marker
    ``'^'``          triangle_up marker
    ``'<'``          triangle_left marker
    ``'>'``          triangle_right marker
    ``'1'``          tri_down marker
    ``'2'``          tri_up marker
    ``'3'``          tri_left marker
    ``'4'``          tri_right marker
    ``'s'``          square marker
    ``'p'``          pentagon marker
    ``'*'``          star marker
    ``'h'``          hexagon1 marker
    ``'H'``          hexagon2 marker
    ``'+'``          plus marker
    ``'x'``          x marker
    ``'D'``          diamond marker
    ``'d'``          thin_diamond marker
    ``'|'``          vline marker
    ``'_'``          hline marker
    =============    ===============================
Line Styles
    ========  ===============================
    character  description
    ======== ===============================
    -          solid line style
    --         dashed line style
    -.         dash-dot line style
    :          dotted line style
    ''			无
    ========  ===============================
案例
plt.plot(_xages, _y1girls,'g^:', label="第一个人")
plt.plot(_xages, _y2girls, '-or', label="第二个人")

plt.legend(loc="upper left", prop=font)
plt.show()
1.9 标记特殊的点
待续
1.10 给图片添加水印
待续
小结
3. matplotlib 画其他图
3.1 散点图
plt.scatter(x,y)
案例 —— 绘制3月和10月所有气温的散点图
from matplotlib import pyplot as plt
from matplotlib import font_manager

font = font_manager.FontProperties(fname="C:\Windows\Fonts\MSYH.ttc")

# 0. 准备数据
y1 = [11,17,16,11,12,11,12,6,6,7,8,9,12,15,14,17,18,21,16,17,20,14,15,15,15,19,21,22,22,22,23]
y2 = [26,26,28,19,21,17,16,19,18,20,20,19,22,23,17,20,21,20,22,15,11,15,5,13,17,10,11,13,12,13,6]
x1 = range(31)
x2 = range(50,81)
x1_labels = [f"3月{i+1}日" for i in x1]
x2_labels = [f"10月{i-50+1}日" for i in x2]
# 1.设置图形大小
plt.figure(figsize=(20,6),dpi=200)
# 2. 设置坐标文字
plt.xticks(  (list(x1)+list(x2))[::3], (list(x1_labels)+list(x2_labels))[::3],fontproperties=font, rotation=45)
plt.scatter(x1,y1)
plt.scatter(x2,y2)
plt.show()
3.2 条形图
plot.bar
横坐标是离散的,条形图;
横坐标是连续的,直方图
a. 正常条形图 —— plt.bar
- 也是使用数字来画x轴,然后使用
xticks来修改文字
from matplotlib import pyplot as plt
from matplotlib import font_manager

"""绘制条形图  plt.bar"""

# 假设你获取到了2017年内地电影票房前20的电影(列表a)和电影票房数据(列表b),那么如何更加直观的展示该数据?

a = ["战狼2", "速度与激情8", "功夫瑜伽", "西游伏妖篇", "变形金刚5:最后的骑士", "摔跤吧!爸爸", "加勒比海盗5:死无对证", "金刚:骷髅岛", "极限特工:终极回归", "生化危机6:终章",
     "乘风破浪", "神偷奶爸3", "智取威虎山", "大闹天竺", "金刚狼3:殊死一战", "蜘蛛侠:英雄归来", "悟空传", "银河护卫队2", "情圣", "新木乃伊", ]

b = [56.01, 26.94, 17.53, 16.49, 15.45, 12.96, 11.8, 11.61, 11.28, 11.12, 10.49, 10.3, 8.75, 7.55, 7.32, 6.99, 6.88,
     6.86, 6.58, 6.23]

font = font_manager.FontProperties(fname="C:/Windows/Fonts/MSYH.ttc")

plt.bar(range(len(a)), b, width=0.5)
plt.xticks(range(len(a)), a, fontproperties=font, rotation=90)
plt.show()
b. 垂直条形图 —— plt.barh
from matplotlib import pyplot as plt
from matplotlib import font_manager

"""绘制条形图  plt.bar"""

# 假设你获取到了2017年内地电影票房前20的电影(列表a)和电影票房数据(列表b),那么如何更加直观的展示该数据?

a = ["战狼2", "速度与激情8", "功夫瑜伽", "西游伏妖篇", "变形金刚5:最后的骑士", "摔跤吧!爸爸", "加勒比海盗5:死无对证", "金刚:骷髅岛", "极限特工:终极回归", "生化危机6:终章",
     "乘风破浪", "神偷奶爸3", "智取威虎山", "大闹天竺", "金刚狼3:殊死一战", "蜘蛛侠:英雄归来", "悟空传", "银河护卫队2", "情圣", "新木乃伊", ]

b = [56.01, 26.94, 17.53, 16.49, 15.45, 12.96, 11.8, 11.61, 11.28, 11.12, 10.49, 10.3, 8.75, 7.55, 7.32, 6.99, 6.88,
     6.86, 6.58, 6.23]
#
# 单位:亿

font = font_manager.FontProperties(fname="C:/Windows/Fonts/MSYH.ttc")

# plt.bar(range(len(a)), b, width=0.5)
plt.barh(range(len(a)), b, height=0.5)

plt.yticks(range(len(a)), a, fontproperties=font)
plt.show()
案例 —— 多个条形图对比票房
# 假设你知道了列表a中电影分别在2017-09-14(b_14), 2017-09-15(b_15), 2017-09-16(b_16)
# 三天的票房,为了展示列表中电影本身的票房以及同其他电影的数据对比情况,应该如何更加直观的呈现该数据?

# 假设你知道了列表a中电影分别在2017-09-14(b_14), 2017-09-15(b_15), 2017-09-16(b_16)
# 三天的票房,为了展示列表中电影本身的票房以及同其他电影的数据对比情况,应该如何更加直观的呈现该数据?
from matplotlib import pyplot as plt
from matplotlib import font_manager

names = ["猩球崛起3:终极之战", "敦刻尔克", "蜘蛛侠:英雄归来", "战狼2"]

# 长度除开 12个画柱子的,还要算上间隔
bar_width = 0.1
a = range(len(names))

x_14 = a
x_15 = [i + bar_width for i in a]
x_16 = [i + 2 * bar_width for i in a]
b_14 = [2358, 399, 2358, 362]
b_15 = [12357, 156, 2045, 168]
b_16 = [15746, 312, 4497, 319]

font = font_manager.FontProperties(fname="C:/Windows/Fonts/MSYH.ttc")

plt.bar(x_14, b_14, label="2017-09-14", width=bar_width)
plt.bar(x_15, b_15, label="2017-09-15", width=bar_width)
plt.bar(x_16, b_16, label="2017-09-16", color="red", width=bar_width)
# 设置电影名称
plt.xticks(x_15, names, fontproperties=font)
# 设置网格
plt.grid(alpha=0.4, axis="y")
# 图例
plt.legend(loc="best")
plt.show()
3.3 直方图 —— plt.hist
有一组原始数据,没有统计过的,将它绘制在连续区间内
plt.hist(原始值, bins, density)
- hist只能绘制没有统计过的数据,如果已经统计了每个区间是多少个,那么应该使用bar
- bins可以为数字,代表分成几个区间; 也可以为listi指定每个区间的边缘值
- density是bool值,代表是否以频率分布来绘制
from matplotlib import pyplot as plt
a=[131,  98, 125, 131, 124, 139, 131, 117, 128, 108, 135, 138, 131, 102, 107, 114, 119, 128, 121, 142, 127, 130, 124, 101, 110, 116, 117, 110, 128, 128, 115,  99, 136, 126, 134,  95, 138, 117, 111,78, 132, 124, 113, 150, 110, 117,  86,  95, 144, 105, 126, 130,126, 130, 126, 116, 123, 106, 112, 138, 123,  86, 101,  99, 136,123, 117, 119, 105, 137, 123, 128, 125, 104, 109, 134, 125, 127,105, 120, 107, 129, 116, 108, 132, 103, 136, 118, 102, 120, 114,105, 115, 132, 145, 119, 121, 112, 139, 125, 138, 109, 132, 134,156, 106, 117, 127, 144, 139, 139, 119, 140,  83, 110, 102,123,107, 143, 115, 136, 118, 139, 123, 112, 118, 125, 109, 119, 133,112, 114, 122, 109, 106, 123, 116, 131, 127, 115, 118, 112, 135,115, 146, 137, 116, 103, 144,  83, 123, 111, 110, 111, 100, 154,136, 100, 118, 119, 133, 134, 106, 129, 126, 110, 111, 109, 141,120, 117, 106, 149, 122, 122, 110, 118, 127, 121, 114, 125, 126,114, 140, 103, 130, 141, 117, 106, 114, 121, 114, 133, 137,  92,121, 112, 146,  97, 137, 105,  98, 117, 112,  81,  97, 139, 113,134, 106, 144, 110, 137, 137, 111, 104, 117, 100, 111, 101, 110,105, 129, 137, 112, 120, 113, 133, 112,  83,  94, 146, 133, 101,131, 116, 111,  84, 137, 115, 122, 106, 144, 109, 123, 116, 111,111, 133, 150]

# 指定bin的宽度
bin_width = 10
# 计算每个bin的边沿值
bin_edges = [number for number in range(min(a), max(a)+bin_width, bin_width)]

plt.hist(a,density=True, bins = bin_edges)
plt.xticks(bin_edges)
plt.grid()
plt.show()
案例 —— 普查分布
from matplotlib import pyplot as plt
interval = [0,5,10,15,20,25,30,35,40,45,60,90]
width = [5,5,5,5,5,5,5,5,5,15,30,60]
quantity = [836,2737,3723,3926,3596,1438,3273,642,824,613,215,47]
# 设置图片大小
plt.figure(figsize=(20,7), dpi=200)
# 计算绘制中心的位置
_x = [i+w/2 for i,w in zip(interval, width)]
# 绘图并且指定每个bin的宽度
plt.bar(_x, quantity,width=width)
# 设置横轴坐标
plt.xticks(interval+[150])
plt.grid()
plt.show()
3.4 其他绘图工具
- JS前端绘图如: echarts
- python交互式绘图工具: plotly
- 和matplotlib一样的静态绘图: seaborn
4. numpy
4.1 创建数组
| 使用 | |
|---|---|
np.array([1,2,3,4]) |
创建一维数组 |
np.array(range(5)) |
创建一维数组 |
np.arange(1,10,2, dtype=None) |
创建一维数组 |
np.zeros( (shape)) |
|
np.ones( (shape) ) |
|
np.eye(3) |
创建对焦阵 |
数组类型为numpy.ndarray
import numpy as np

a = np.array([1,2,3,4])
b = np.arange(10)
print(a)
print(type(a))
4.2 类型
numpy会自动根据传入的数据推断类型,也可以
- 显示指定类型
- 查看类型
- 改变类型
| 使用 | |
|---|---|
数组.dtype |
查看类型 |
新数组 = np.array(..., dtype=类型) |
创建数组并且指定类型 |
新数组 = np.arange(..., dtype=类型) |
创建数组并且指定类型 |
新数组 = 数组.astype(类型) |
修改类型 |
类型示例:
float
int
bool
np.bool
np.int
np.float
"float32"
"f16"
...
四舍五入小数 —— np.round(数组, 小数位)
b = np.round(a, 2)
4.3 形状
| 使用 | |
|---|---|
数组.shape |
|
新数组= 数组.reshape( (形状元祖) ) |
|
新数组 = 数组.flatten() |
展开成一维数组 |
转换成一维数组:
a = np.arange(12).reshape((2,2,3))
b = a.reshape( (12,) )  # 这是变成一维数组
b = a.reshape( (12,1))  # 这是12行1列的二维数组
b = a.reshape( (1,12))  # 这是1行12列的二维数组
b = a.flatten()   #  这是变成一维数组
4.4 计算
- 数组和数字运算
- 数组和数组运算
- 形状相同: 对应位置计算
- 和某行形状相同: 列广播
- 和某列形状相同: 行广播
★广播
"""广播"""
import numpy as np

# a 是 2行6列
a = np.arange(12).reshape(2,6)

# b 是 1行6列
b = np.arange(6).reshape(1,6)
# c 是 2行1列
c = np.arange(2).reshape(2,1)
print(a + b)
print(a * b)
print(a + c)
print(a * c)
4.5 轴
轴可以理解为方向,0,1,2… 数字表示。
数组.shape返回的就是0轴、1轴…的长度
轴数字的含义不是固定的
- 一维中, 0轴就是唯一方向
- 二维中,0轴是x方向,1轴是y方向
- 三维中,0轴是z方向,1是x方向,2是y方向
所以0轴总是的含义不是永远固定的,看维度
4.6 numpy读取本地数据
np.loadtxt()

def loadtxt(fname, dtype=float, comments='#', delimiter=None,
            converters=None, skiprows=0, usecols=None, unpack=False,
            ndmin=0, encoding='bytes'):
fname: 文件名
converters: 可选的字典,用来指定每一列的数据经过什么函数做处理
	converters = {0: datestr2num}
skiprows: 跳过头几行
usecols: 数字或者sequence,表示要保留那几列,从0开始代表第一列
unpack: 是否将结果转置
4.7 转置
三种方法:
新数组= t.transpose()新数组= t.T新数组= t.swapaxes(轴数,轴数)
4.8 ★★索引和切片
数组[行,列]
- 1个单元格的内容:
a[3,4]( 4行5列的单元格) - 连续的几行:
a[1:5, :]( 2行-5行的所有) - 间隔的几行:
a[ 2:10:2 ,:](3-10行,每个1行取一次 —— 步长 ) - 不连续的几行:
a[ [1,3,4] , : ](2,4,5行的所有) - 交叉的行列:
a[ 2:4, 3:5 ]( 3-4行和4-5列交叉的单元格们) - ▲离散的几个单元格
a[ [0,1,4,5 ] , [ 6,8,4,1] ](单元格(0,6) ( 1,8) ( 4,4) (5,1) 的内容)
a. 布尔索引
可以在索引中传入和原数组维度一样的bool数组来索引,所有True会保留,False会丢失。
t[ t < 10]
b. 值替换
可以直接给索引的结果赋值,这会改变原数组的内容。
c. np中的“三元运算符" —— np.where
要将满足某个条件的值替换成"a",不满足的替换成"b"
d. np.clip
把所有小于某个数字的 值都替换成这个数字; 将所有大于某个数字的值都替换成这个数字
4.9 np.nan和 np.inf
出现nan的情况:
- 读取本地文件为float类型时,如果出现缺失,则为 nan
- 当做了一个不合适的操作(0/0, inf-inf)
np.nan的类型是
float
inf表示无穷大, -inf表示负无穷大
出现inf的情况:
- 出现一个数字除以0
type(np.inf)
Out[35]: float
type(np.nan)
Out[36]: float
a. nan的特点
- nan和任何值计算都是nan
- 两个nan之间不相等:
np.nan == np.nan  # False
np.nan != np.nan  # True
利用上述特点,可以计算nan的个数:
np.count_nonzero( t != t)
np.sum( t == t)
np.sum(np.isnan( t ))
b. 如何处理nan
不宜把nan全部替换为0, 最好是:
- 替换成均值
- 替换成中值
- 直接删除缺失一行
4.10 np常用统计函数
| 函数 | |
|---|---|
t.sum(axis=None) |
|
t.mean(axis=None) |
|
np.median(t, axis=None) |
|
t.max(aixs=None) |
|
t.min(axis=None) |
|
np.ptp(t, axis=None) |
极值 |
t.std(axis=None) |
案例—— 将nan替换成均值
import numpy as np

a = np.arange(16).reshape(4, 4).astype("float")
a[0:2, 1:3] = np.nan
print(a)

"""将缺失的nan用本列其他值的均值替换"""

for i in range(a.shape[1]):
    col = a[:, i]
    # 判断是否有nan
    if np.sum(np.isnan(col)) > 0:
        # 计算均值
        nonan_col = col[col==col]
        mean = nonan_col.mean()
        # 替换nan
        col[col!=col] = mean
print(a)
4.11 数组拼接
np.vstack()和np.hstack()
4.12 行列交换
4.13 产生随机数
| 方法 | |
|---|---|
np.random.rand(d0, d1, ... dn) |
创建d0-dn维度的均匀分布随机数组,浮点类型,0-1 |
np.random.randn(d0, d1, ... dn) |
创建d0-dn维度的 标准正态分布 随机数组 |
np.random.randint(low, high, (shape)) |
创建shape形状的从low-high的随机整数数组 |
np.random.uniform(low, high, (shape) |
创建shape形状的从low-high的 均匀分布数组 |
np.random.normal(loc, scale, (shape) ) |
指定均值(loc), 标准差(scale)的shape形状正态分布数组 |
np.random.seed(s) |
设置随机数种子 |
4.14 其他方法
| 方法 | |
|---|---|
np.argmax(t, axis = None) |
获取最大值的索引位置 |
np.argmin(t, axis=None) |
获取最小值的索引位置 |
4.15 ★numpy数组的拷贝 —— t.copy()
无论是a=b这种,还是 a=b[:]索引的这种,获得的都是浅拷贝,他们之间都会互相影响
想获得不影响的,只有使用:
a = b.copy()


