Kaggle比赛----LANL Earthquake Prediction(Baseline)
第一次较完整地kaggle比赛接近尾声,LANL Earthquake Prediction,先做一篇类似于baseline的东西吧,由于自己看为主,所以简单的一些代码不会全部写出来,主要作为一个思路。比赛地址为:https://www.kaggle.com/c/LANL-Earthquake-Prediction
题目介绍:
In this competition, you will address when the earthquake will take place. Specifically, you’ll predict the time remaining before laboratory earthquakes occur from real-time seismic data.
简单来说就是通过 Los Alamos National Laboratory给出的地震信号,来预测下一次地震的剩余时间。
初探数据:
import pandas as pd
import numpy as np
train = pd.read_csv('Desktop/kaggle/train.csv', dtype={'acoustic_data': np.int16, 'time_to_failure': np.float32})
train.head()
| acoustic_data | time_to_failure | |
|---|---|---|
| 0 | 12 | 1.4691 |
| 1 | 6 | 1.4691 |
| 2 | 8 | 1.4691 |
| 3 | 5 | 1.4691 |
| 4 | 8 | 1.4691 |
发现只有一个维度的数据,显然是要做特征的组合了。再看看数据的shape:(629145480, 2)
6亿多条数据,相当庞大。
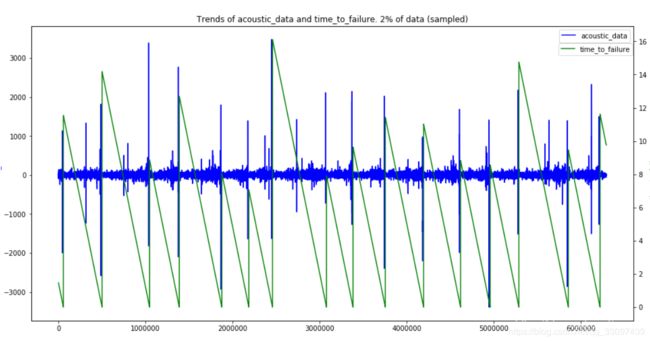
接下来就是对数据进行画图来进一步探勘,首先可以筛选1%或者2%来看,::50,::100。
fig, ax1 = plt.subplots(figsize=(16, 8))
plt.title("Trends of acoustic_data and time_to_failure. First 2% of data")
plt.plot(train['acoustic_data'].values[:12582910], color='b')
ax1.set_ylabel('acoustic_data', color='b')
plt.legend(['acoustic_data'])
ax2 = ax1.twinx()
plt.plot(train['time_to_failure'].values[:12582910], color='g')
ax2.set_ylabel('time_to_failure', color='g')
plt.legend(['time_to_failure'], loc=(0.875, 0.9))
plt.grid(False)
plt.show()
可以看出y大致是一个跟随着X进行有周期的波动,且一个周期大部分处于平稳状态,但当X有巨大波动时,往往Y有着巨大波动。
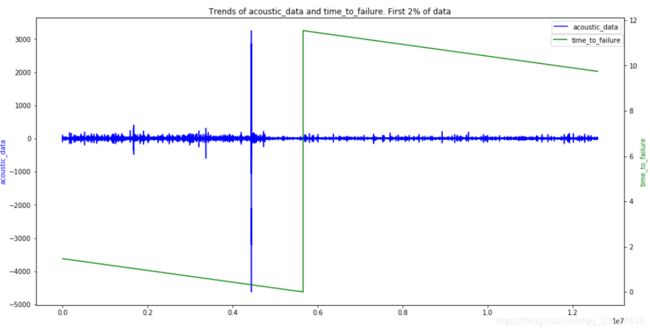
感觉第一个周期大致在3%之内吧,可以看前2%,3%之类的数据的具体情况。
fig, ax1 = plt.subplots(figsize=(16, 8))
plt.title("Trends of acoustic_data and time_to_failure. First 2% of data")
plt.plot(train['acoustic_data'].values[:12582910], color='b')
ax1.set_ylabel('acoustic_data', color='b')
plt.legend(['acoustic_data'])
ax2 = ax1.twinx()
plt.plot(train['time_to_failure'].values[:12582910], color='g')
ax2.set_ylabel('time_to_failure', color='g')
plt.legend(['time_to_failure'], loc=(0.875, 0.9))
plt.grid(False)
plt.show()
发现time_to_failure紧跟着一次X的大波动后有了大波动。。。
看看数据有没有缺实
stats = []
for col in train.columns:
    stats.append((col, train[col].isnull().sum() * 100 / train.shape[0]))

stats_df = pd.DataFrame(stats, columns=['column', 'percentage of missing'])
stats_df
del stats
del stats_df
发现没有缺实值。
特征工程:
for segment in tqdm_notebook(range(segments)):
    seg = train.iloc[segment*rows:segment*rows+rows]
    x = pd.Series(seg['acoustic_data'].values)
    y = seg['time_to_failure'].values[-1]

    y_tr.loc[segment, 'time_to_failure'] = y
    X_tr.loc[segment, 'mean'] = x.mean()
    X_tr.loc[segment, 'std'] = x.std()
    X_tr.loc[segment, 'max'] = x.max()
    X_tr.loc[segment, 'min'] = x.min()

    X_tr.loc[segment, 'mean_change_abs'] = np.mean(np.diff(x))
    X_tr.loc[segment, 'mean_change_rate'] = calc_change_rate(x)
    X_tr.loc[segment, 'abs_max'] = np.abs(x).max()
    X_tr.loc[segment, 'abs_min'] = np.abs(x).min()

    X_tr.loc[segment, 'std_first_50000'] = x[:50000].std()
    X_tr.loc[segment, 'std_last_50000'] = x[-50000:].std()
    X_tr.loc[segment, 'std_first_10000'] = x[:10000].std()
    X_tr.loc[segment, 'std_last_10000'] = x[-10000:].std()

    X_tr.loc[segment, 'avg_first_50000'] = x[:50000].mean()
    X_tr.loc[segment, 'avg_last_50000'] = x[-50000:].mean()
    X_tr.loc[segment, 'avg_first_10000'] = x[:10000].mean()
    X_tr.loc[segment, 'avg_last_10000'] = x[-10000:].mean()

    X_tr.loc[segment, 'min_first_50000'] = x[:50000].min()
    X_tr.loc[segment, 'min_last_50000'] = x[-50000:].min()
    X_tr.loc[segment, 'min_first_10000'] = x[:10000].min()
    X_tr.loc[segment, 'min_last_10000'] = x[-10000:].min()

    X_tr.loc[segment, 'max_first_50000'] = x[:50000].max()
    X_tr.loc[segment, 'max_last_50000'] = x[-50000:].max()
    X_tr.loc[segment, 'max_first_10000'] = x[:10000].max()
    X_tr.loc[segment, 'max_last_10000'] = x[-10000:].max()

    X_tr.loc[segment, 'max_to_min'] = x.max() / np.abs(x.min())
    X_tr.loc[segment, 'max_to_min_diff'] = x.max() - np.abs(x.min())
    X_tr.loc[segment, 'count_big'] = len(x[np.abs(x) > 500])
    X_tr.loc[segment, 'sum'] = x.sum()

    X_tr.loc[segment, 'mean_change_rate_first_50000'] = calc_change_rate(x[:50000])
    X_tr.loc[segment, 'mean_change_rate_last_50000'] = calc_change_rate(x[-50000:])
    X_tr.loc[segment, 'mean_change_rate_first_10000'] = calc_change_rate(x[:10000])
    X_tr.loc[segment, 'mean_change_rate_last_10000'] = calc_change_rate(x[-10000:])

    X_tr.loc[segment, 'q95'] = np.quantile(x, 0.95)
    X_tr.loc[segment, 'q99'] = np.quantile(x, 0.99)
    X_tr.loc[segment, 'q05'] = np.quantile(x, 0.05)
    X_tr.loc[segment, 'q01'] = np.quantile(x, 0.01)

    X_tr.loc[segment, 'abs_q95'] = np.quantile(np.abs(x), 0.95)
    X_tr.loc[segment, 'abs_q99'] = np.quantile(np.abs(x), 0.99)
    X_tr.loc[segment, 'abs_q05'] = np.quantile(np.abs(x), 0.05)
    X_tr.loc[segment, 'abs_q01'] = np.quantile(np.abs(x), 0.01)

    X_tr.loc[segment, 'trend'] = add_trend_feature(x)
    X_tr.loc[segment, 'abs_trend'] = add_trend_feature(x, abs_values=True)
    X_tr.loc[segment, 'abs_mean'] = np.abs(x).mean()
    X_tr.loc[segment, 'abs_std'] = np.abs(x).std()

    X_tr.loc[segment, 'mad'] = x.mad()
    X_tr.loc[segment, 'kurt'] = x.kurtosis()
    X_tr.loc[segment, 'skew'] = x.skew()
    X_tr.loc[segment, 'med'] = x.median()

    X_tr.loc[segment, 'Hilbert_mean'] = np.abs(hilbert(x)).mean()
    X_tr.loc[segment, 'Hann_window_mean'] = (convolve(x, hann(150), mode='same') / sum(hann(150))).mean()
    X_tr.loc[segment, 'classic_sta_lta1_mean'] = classic_sta_lta(x, 500, 10000).mean()
    X_tr.loc[segment, 'classic_sta_lta2_mean'] = classic_sta_lta(x, 5000, 100000).mean()
    X_tr.loc[segment, 'classic_sta_lta3_mean'] = classic_sta_lta(x, 3333, 6666).mean()
    X_tr.loc[segment, 'classic_sta_lta4_mean'] = classic_sta_lta(x, 10000, 25000).mean()
    X_tr.loc[segment, 'classic_sta_lta5_mean'] = classic_sta_lta(x, 50, 1000).mean()
    X_tr.loc[segment, 'classic_sta_lta6_mean'] = classic_sta_lta(x, 100, 5000).mean()
    X_tr.loc[segment, 'classic_sta_lta7_mean'] = classic_sta_lta(x, 333, 666).mean()
    X_tr.loc[segment, 'classic_sta_lta8_mean'] = classic_sta_lta(x, 4000, 10000).mean()
    X_tr.loc[segment, 'Moving_average_700_mean'] = x.rolling(window=700).mean().mean(skipna=True)
    ewma = pd.Series.ewm
    X_tr.loc[segment, 'exp_Moving_average_300_mean'] = (ewma(x, span=300).mean()).mean(skipna=True)
    X_tr.loc[segment, 'exp_Moving_average_3000_mean'] = ewma(x, span=3000).mean().mean(skipna=True)
    X_tr.loc[segment, 'exp_Moving_average_30000_mean'] = ewma(x, span=30000).mean().mean(skipna=True)
    no_of_std = 3
    X_tr.loc[segment, 'MA_700MA_std_mean'] = x.rolling(window=700).std().mean()
    X_tr.loc[segment,'MA_700MA_BB_high_mean'] = (X_tr.loc[segment, 'Moving_average_700_mean'] + no_of_std * X_tr.loc[segment, 'MA_700MA_std_mean']).mean()
    X_tr.loc[segment,'MA_700MA_BB_low_mean'] = (X_tr.loc[segment, 'Moving_average_700_mean'] - no_of_std * X_tr.loc[segment, 'MA_700MA_std_mean']).mean()
    X_tr.loc[segment, 'MA_400MA_std_mean'] = x.rolling(window=400).std().mean()
    X_tr.loc[segment,'MA_400MA_BB_high_mean'] = (X_tr.loc[segment, 'Moving_average_700_mean'] + no_of_std * X_tr.loc[segment, 'MA_400MA_std_mean']).mean()
    X_tr.loc[segment,'MA_400MA_BB_low_mean'] = (X_tr.loc[segment, 'Moving_average_700_mean'] - no_of_std * X_tr.loc[segment, 'MA_400MA_std_mean']).mean()
    X_tr.loc[segment, 'MA_1000MA_std_mean'] = x.rolling(window=1000).std().mean()
    X_tr.drop('Moving_average_700_mean', axis=1, inplace=True)

    X_tr.loc[segment, 'iqr'] = np.subtract(*np.percentile(x, [75, 25]))
    X_tr.loc[segment, 'q999'] = np.quantile(x,0.999)
    X_tr.loc[segment, 'q001'] = np.quantile(x,0.001)
    X_tr.loc[segment, 'ave10'] = stats.trim_mean(x, 0.1)

    for windows in [10, 100, 1000]:
        x_roll_std = x.rolling(windows).std().dropna().values
        x_roll_mean = x.rolling(windows).mean().dropna().values

        X_tr.loc[segment, 'ave_roll_std_' + str(windows)] = x_roll_std.mean()
        X_tr.loc[segment, 'std_roll_std_' + str(windows)] = x_roll_std.std()
        X_tr.loc[segment, 'max_roll_std_' + str(windows)] = x_roll_std.max()
        X_tr.loc[segment, 'min_roll_std_' + str(windows)] = x_roll_std.min()
        X_tr.loc[segment, 'q01_roll_std_' + str(windows)] = np.quantile(x_roll_std, 0.01)
        X_tr.loc[segment, 'q05_roll_std_' + str(windows)] = np.quantile(x_roll_std, 0.05)
        X_tr.loc[segment, 'q95_roll_std_' + str(windows)] = np.quantile(x_roll_std, 0.95)
        X_tr.loc[segment, 'q99_roll_std_' + str(windows)] = np.quantile(x_roll_std, 0.99)
        X_tr.loc[segment, 'av_change_abs_roll_std_' + str(windows)] = np.mean(np.diff(x_roll_std))
        X_tr.loc[segment, 'av_change_rate_roll_std_' + str(windows)] = np.mean(np.nonzero((np.diff(x_roll_std) / x_roll_std[:-1]))[0])
        X_tr.loc[segment, 'abs_max_roll_std_' + str(windows)] = np.abs(x_roll_std).max()

        X_tr.loc[segment, 'ave_roll_mean_' + str(windows)] = x_roll_mean.mean()
        X_tr.loc[segment, 'std_roll_mean_' + str(windows)] = x_roll_mean.std()
        X_tr.loc[segment, 'max_roll_mean_' + str(windows)] = x_roll_mean.max()
        X_tr.loc[segment, 'min_roll_mean_' + str(windows)] = x_roll_mean.min()
        X_tr.loc[segment, 'q01_roll_mean_' + str(windows)] = np.quantile(x_roll_mean, 0.01)
        X_tr.loc[segment, 'q05_roll_mean_' + str(windows)] = np.quantile(x_roll_mean, 0.05)
        X_tr.loc[segment, 'q95_roll_mean_' + str(windows)] = np.quantile(x_roll_mean, 0.95)
        X_tr.loc[segment, 'q99_roll_mean_' + str(windows)] = np.quantile(x_roll_mean, 0.99)
        X_tr.loc[segment, 'av_change_abs_roll_mean_' + str(windows)] = np.mean(np.diff(x_roll_mean))
        X_tr.loc[segment, 'av_change_rate_roll_mean_' + str(windows)] = np.mean(np.nonzero((np.diff(x_roll_mean) / x_roll_mean[:-1]))[0])
        X_tr.loc[segment, 'abs_max_roll_mean_' + str(windows)] = np.abs(x_roll_mean).max()
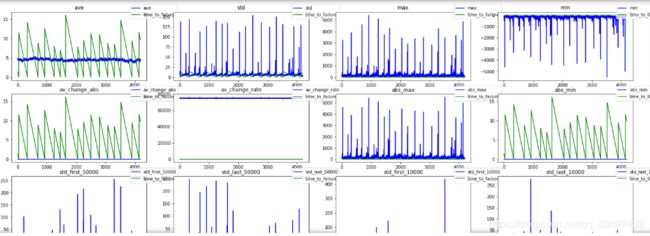
也就是构造组合一些特征,主要有平均值,方差,max,min,还有有效微震信号的STA/LTA(短时窗平均/长时窗平均)算法所构成的特征。对前面的24张图进行plot可以看到一些特征的图像。
plt.figure(figsize=(26, 24))
for i, col in enumerate(X_tr.columns):
    plt.subplot(7, 4, i+1)
    plt.plot(X_tr[col], color='blue')
    plt.title(col)
    ax1.set_ylabel(col, color='b')
    # plt.legend([col])
    ax2 = ax1.twinx()
    plt.plot(y_tr, color='g')
    ax2.set_ylabel('time_to_failure', color='g')
    plt.legend([col, 'time_to_failure'], loc=(0.875, 0.9))
    plt.grid(False)
plt.show()
然后准备对submission和测试数据进行处理,首先是标准化。
from sklearn import preprocessing
scaler = preprocessing.StandardScaler()
scaler.fit(X_tr)
X_train_scaled = pd.DataFrame(scaler.transform(X_tr), columns=X_tr.columns)
这里要提一下的是,由于submission也就是test数据里给出的segment是1500000条数据集合成一个的样子,也就是说我们也应该把train划分成1500000一个作为真正的训练样本,且在这个基础上构造特征,一共有4192个train segments划分为1500000条数据一个。
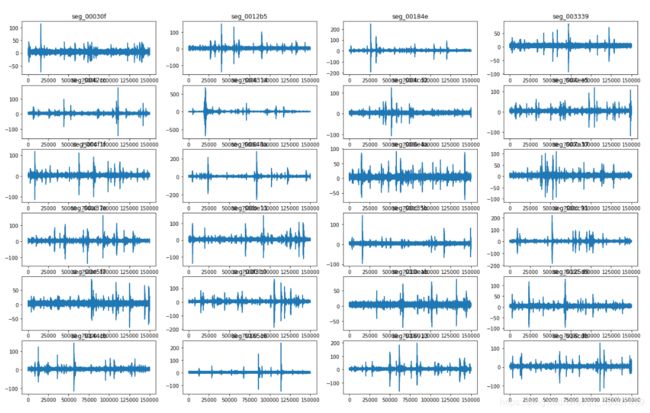
接下来是看看test数据:
submission = pd.read_csv('Desktop/kaggle/sample_submission.csv',index_col='seg_id')
X_test = pd.DataFrame(columns=X_tr.columns,dtype=np.float64,index=submission.index)
plt.figure(figsize=(22,16))

for i,seg_id in enumerate(tqdm_notebook(X_test.index)):
    seg = pd.read_csv('Desktop/kaggle/test/'+seg_id+'.csv')

    x = seg['acoustic_data'].values
    X_test.loc[seg_id,'ave'] = x.mean()
    X_test.loc[seg_id,'std'] = x.std()
    X_test.loc[seg_id, 'max'] = x.max()
    X_test.loc[seg_id, 'min'] = x.min()

    X_test.loc[seg_id,'av_change_abs'] = np.mean(np.diff(x))
    X_test.loc[seg_id,'av_change_rate'] = np.mean((np.nonzero(np.diff(x)/x[:-1]))[0])
    X_test.loc[seg_id, 'abs_max'] = np.abs(x).max()
    X_test.loc[seg_id, 'abs_min'] = np.abs(x).min()

    X_test.loc[seg_id, 'std_first_50000'] = x[:50000].std()
    X_test.loc[seg_id, 'std_last_50000'] = x[-50000:].std()
    X_test.loc[seg_id, 'std_first_10000'] = x[:10000].std()
    X_test.loc[seg_id, 'std_last_10000'] = x[-10000:].std()

    X_test.loc[seg_id, 'avg_first_50000'] = x[:50000].mean()
    X_test.loc[seg_id, 'avg_last_50000'] = x[-50000:].mean()
    X_test.loc[seg_id, 'avg_first_10000'] = x[:10000].mean()
    X_test.loc[seg_id, 'avg_last_10000'] = x[-10000:].mean()

    X_test.loc[seg_id, 'min_first_50000'] = x[:50000].min()
    X_test.loc[seg_id, 'min_last_50000'] = x[-50000:].min()
    X_test.loc[seg_id, 'min_first_10000'] = x[:10000].min()
    X_test.loc[seg_id, 'min_last_10000'] = x[-10000:].min()

    X_test.loc[seg_id, 'max_first_50000'] = x[:50000].max()
    X_test.loc[seg_id, 'max_last_50000'] = x[-50000:].max()
    X_test.loc[seg_id, 'max_first_10000'] = x[:10000].max()
    X_test.loc[seg_id, 'max_last_10000'] = x[-10000:].max()

    if i < 24:
        plt.subplot(7, 4, i + 1)
        plt.plot(seg['acoustic_data'])
        plt.title(seg_id)

X_test_scaled = pd.DataFrame(scaler.transform(X_test), columns=X_test.columns)
模型建立:
5折fold做交叉验证,因为后面要用到stacking,这也是常规做法。
n_fold = 5
folds = KFold(n_splits=n_fold, shuffle=True, random_state=11)
模型选择有cat,lgb,xgboost。
def train_model(X=X_train_scaled, X_test=X_test_scaled, y=y_tr, params=None, folds=folds, model_type='lgb', plot_feature_importance=False, model=None):

    oof = np.zeros(len(X))
    prediction = np.zeros(len(X_test))
    scores = []
    feature_importance = pd.DataFrame()
    for fold_n, (train_index, valid_index) in enumerate(folds.split(X)):
        print('Fold', fold_n, 'started at', time.ctime())
        X_train, X_valid = X.iloc[train_index], X.iloc[valid_index]
        y_train, y_valid = y.iloc[train_index], y.iloc[valid_index]

        if model_type == 'lgb':
            model = lgb.LGBMRegressor(**params, n_estimators = 50000, n_jobs = -1)
            model.fit(X_train, y_train,
                    eval_set=[(X_train, y_train), (X_valid, y_valid)], eval_metric='mae',
                    verbose=10000, early_stopping_rounds=200)

            y_pred_valid = model.predict(X_valid)
            y_pred = model.predict(X_test, num_iteration=model.best_iteration_)

        if model_type == 'xgb':
            train_data = xgb.DMatrix(data=X_train, label=y_train, feature_names=X.columns)
            valid_data = xgb.DMatrix(data=X_valid, label=y_valid, feature_names=X.columns)

            watchlist = [(train_data, 'train'), (valid_data, 'valid_data')]
            model = xgb.train(dtrain=train_data, num_boost_round=20000, evals=watchlist, early_stopping_rounds=200, verbose_eval=500, params=params)
            y_pred_valid = model.predict(xgb.DMatrix(X_valid, feature_names=X.columns), ntree_limit=model.best_ntree_limit)
            y_pred = model.predict(xgb.DMatrix(X_test, feature_names=X.columns), ntree_limit=model.best_ntree_limit)

        if model_type == 'sklearn':
            model = model
            model.fit(X_train, y_train)

            y_pred_valid = model.predict(X_valid).reshape(-1,)
            score = mean_absolute_error(y_valid, y_pred_valid)
            print(f'Fold {fold_n}. MAE: {score:.4f}.')
            print('')

            y_pred = model.predict(X_test).reshape(-1,)

        if model_type == 'cat':
            model = CatBoostRegressor(iterations=20000,  eval_metric='MAE', **params)
            model.fit(X_train, y_train, eval_set=(X_valid, y_valid), cat_features=[], use_best_model=True, verbose=False)

            y_pred_valid = model.predict(X_valid)
            y_pred = model.predict(X_test)

        oof[valid_index] = y_pred_valid.reshape(-1,)
        scores.append(mean_absolute_error(y_valid, y_pred_valid))

        prediction += y_pred

        if model_type == 'lgb':
            # feature importance
            fold_importance = pd.DataFrame()
            fold_importance["feature"] = X.columns
            fold_importance["importance"] = model.feature_importances_
            fold_importance["fold"] = fold_n + 1
            feature_importance = pd.concat([feature_importance, fold_importance], axis=0)

    prediction /= n_fold

    print('CV mean score: {0:.4f}, std: {1:.4f}.'.format(np.mean(scores), np.std(scores)))

    if model_type == 'lgb':
        feature_importance["importance"] /= n_fold
        if plot_feature_importance:
            cols = feature_importance[["feature", "importance"]].groupby("feature").mean().sort_values(
                by="importance", ascending=False)[:50].index

            best_features = feature_importance.loc[feature_importance.feature.isin(cols)]

            plt.figure(figsize=(16, 12));
            sns.barplot(x="importance", y="feature", data=best_features.sort_values(by="importance", ascending=False));
            plt.title('LGB Features (avg over folds)');

            return oof, prediction, feature_importance
        return oof, prediction

    else:
        return oof, prediction
模型融合如下:
params = {'num_leaves': 128,
          'min_data_in_leaf': 79,
          'objective': 'huber',
          'max_depth': -1,
          'learning_rate': 0.01,
          "boosting": "gbdt",
          "bagging_freq": 5,
          "bagging_fraction": 0.8126672064208567,
          "bagging_seed": 11,
          "metric": 'mae',
          "verbosity": -1,
          'reg_alpha': 0.1302650970728192,
          'reg_lambda': 0.3603427518866501
         }
oof_lgb, prediction_lgb, feature_importance = train_model(params=params, model_type='lgb', plot_feature_importance=True)


top_cols = list(feature_importance[["feature", "importance"]].groupby("feature").mean().sort_values(
                by="importance", ascending=False)[:50].index)

oof_lgb, prediction_lgb, feature_importance = train_model(X=X_train_scaled, X_test=X_test_scaled, params=params, model_type='lgb', plot_feature_importance=True)

xgb_params = {'eta': 0.03,
              'max_depth': 9,
              'subsample': 0.85,
              'objective': 'reg:linear',
              'eval_metric': 'mae',
              'silent': True,
              'nthread': 4}
oof_xgb, prediction_xgb = train_model(X=X_train_scaled, X_test=X_test_scaled, params=xgb_params, model_type='xgb')
model = NuSVR(gamma='scale', nu=0.9, C=10.0, tol=0.01)
oof_svr, prediction_svr = train_model(X=X_train_scaled, X_test=X_test_scaled, params=None, model_type='sklearn', model=model)

model = NuSVR(gamma='scale', nu=0.7, tol=0.01, C=1.0)
oof_svr1, prediction_svr1 = train_model(X=X_train_scaled, X_test=X_test_scaled, params=None, model_type='sklearn', model=model)

params = {'loss_function':'MAE'}
oof_cat, prediction_cat = train_model(X=X_train_scaled, X_test=X_test_scaled, params=params, model_type='cat')


model = KernelRidge(kernel='rbf', alpha=0.1, gamma=0.01)
oof_r, prediction_r = train_model(X=X_train_scaled, X_test=X_test_scaled, params=None, model_type='sklearn', model=model)


train_stack = np.vstack([oof_lgb, oof_xgb, oof_svr, oof_svr1, oof_r, oof_cat]).transpose()
train_stack = pd.DataFrame(train_stack, columns = ['lgb', 'xgb', 'svr', 'svr1', 'r', 'cat'])
test_stack = np.vstack([prediction_lgb, prediction_xgb, prediction_svr, prediction_svr1, prediction_r, prediction_cat]).transpose()
test_stack = pd.DataFrame(test_stack)

oof_lgb_stack, prediction_lgb_stack, feature_importance = train_model(X=train_stack, X_test=test_stack, params=params, model_type='lgb', plot_feature_importance=True)
结果和plot的模型比较之后上传,这样做score是1.54,能排30%左右,感觉还是不错啦。
baseline的过程大概如此了,因为第一次接触这种只有1维的数据,要进行特征的扩展,所以特征工程应该是非常考验功底的。。。所以肯定会在特征工程上进行进一步的拓展。最后的模型这几个应该不会有太大变化。


