Superset集成ECharts(一重奏)
superset版本:0.28
echarts版本:3.8.5
刚开始接到这个任务时,说是要改superset源码,what??嗯…整个人是蒙的。先不管大方面,既然要做superset先安装上。本文以漏斗图为例
环境搭建
操作系统:CentOS Linux release 7.5.1804 (Core)
python版本:3.6.4,对于0.28的superset最好不要用python2要用python3。(注:我是在anaconda下)
装superset前还需要安装nodejs、yarn和webpack,直接去官网下载压缩包![]()
配置环境变量并验证是否安装成功可参考链接
- 安装superset
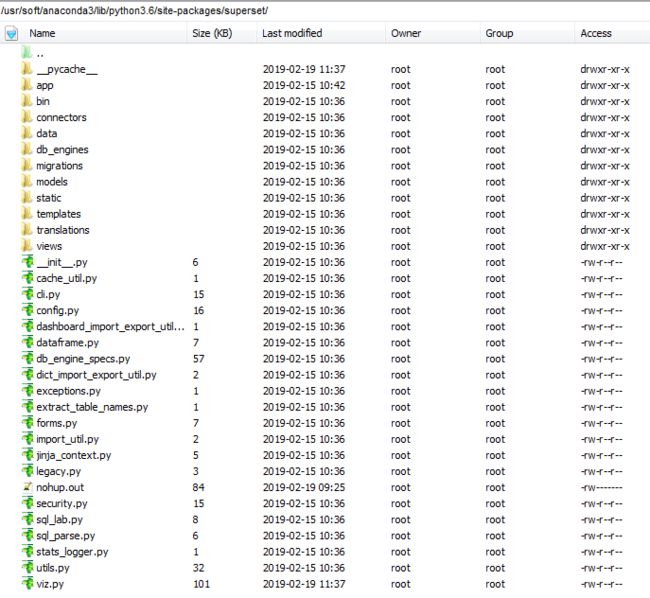
配置成功后即可安装superset,安装好的superset目录和源码目录是有异同的,我们只需要将源码里Superset\superset\assets下的src目录复制到自己superset的安装目录的附带本文superset安装目录superset/static/assets下即可,附带本文superset安装目录以及superset文件目录
[root@localhost superset]# pwd
/usr/soft/anaconda3/lib/python3.6/site-packages/superset
fabmanager create-admin --app superset
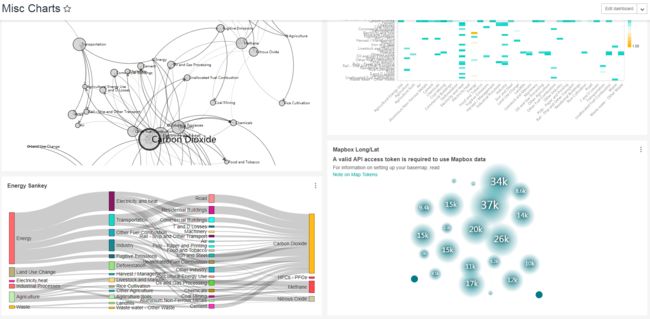
为superset加载一些数据样例
superset load_examples
启动superset
superset runserver -d -p 8088
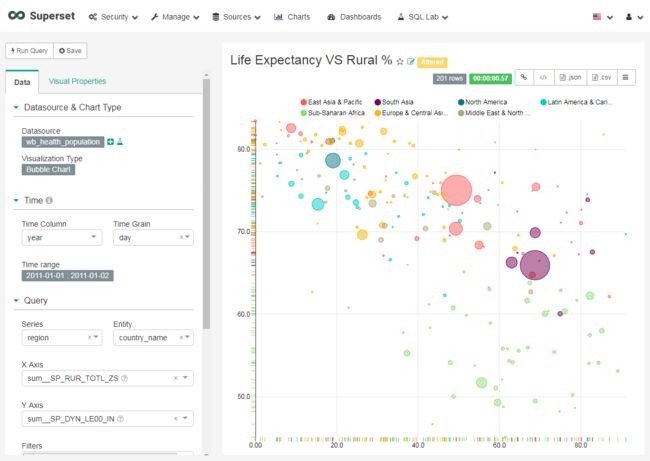
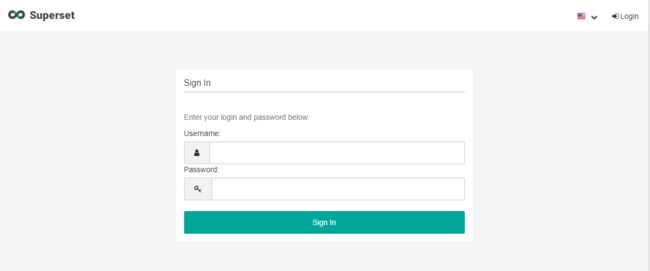
打开浏览器输入你的ip:8088,进入superset页面如下:
集成漏斗图
刚开始做很懵逼,现在想想就是那么几个固定文件的修改,懂得每个文件什么含义即可,接下来只需简单的5步哦,吼吼~~~~
- 导入图片,把漏斗图片echarts_funnel放入superset/static/assets/images/viz_thumbnails文件夹下(图片戳这里,太好看了有木有!)
- ecahrts官网上下载echarts.js包,放到 superset/static/assets/src/exploer中,再把漏斗echarts_funnel.js文件(官网下载吧)拷贝到superset/static/assets/src/visualizations目录下,附上代码内容(注意:js文件还有图片名称要保持一致哦)
import echarts from 'echarts';
import {getColorFromScheme} from '../modules/colors';

function echartsFunnelVis(slice, payload) {
    const div = d3.select(slice.selector);
    var html = '+ slice.width() + ''
        + 'px;height:' + slice.height() + 'px;">haha';
    div.html(html);

    var myChart = echarts.init(document.getElementById('main'));
    var option = {
        title: {
            text: '',
            subtext: '纯属虚构',
            left: 'left',
            top: 'bottom'
        },
        tooltip: {
            trigger: 'item',
            formatter: "{a}
{b} : {c}%"
        },
        toolbox: {
            show: true,
            orient: 'vertical',
            top: 'center',
            feature: {
                dataView: {readOnly: false},
                restore: {},
                saveAsImage: {}
            }
        },
        legend: {
            orient: 'vertical',
            left: 'left',
            data: []
        },
        calculable: true,
        series: [
            {
                name: '漏斗图',
                type: 'funnel',
                width: '40%',
                height: '45%',
                left: '5%',
                top: '50%',
                funnelAlign: 'right',
                center: ['25%', '25%'],  // for pie
                data: []
            },
            {
                name: '金字塔',
                type: 'funnel',
                width: '40%',
                height: '45%',
                left: '5%',
                top: '5%',
                sort: 'ascending',
                funnelAlign: 'right',
                center: ['25%', '75%'],  // for pie
                data: []
            },
            {
                name: '漏斗图',
                type: 'funnel',
                width: '40%',
                height: '45%',
                left: '55%',
                top: '5%',
                funnelAlign: 'left',
                center: ['75%', '25%'],  // for pie
                data: []
            },
            {
                name: '金字塔',
                type: 'funnel',
                width: '40%',
                height: '45%',
                left: '55%',
                top: '50%',
                sort: 'ascending',
                funnelAlign: 'left',
                center: ['75%', '75%'],  // for pie
                data: []
            }
        ]
    };
    myChart.setOption(option);

    const fd = slice.formData;
    const json = payload.data;

    var colors = getColorFromScheme(fd.color_scheme);
    console.log(colors);
    var data_name = [];
    var max_value = 0;
    const data = json;
    data.forEach(function (item, index, array) {
        data_name.push(item['name']);
        if (item['value'] > max_value) {
            max_value = item['value'];
        }
    });
    var tmp_series = [];
    for (var i = 1; i < 5; i++) {
        tmp_series.push({
            data: data
        });
    }
    var option2 = {
        legend: {data: data_name},
        series: tmp_series
    };

    myChart.setOption(option2);
}

module.exports = echartsFunnelVis;
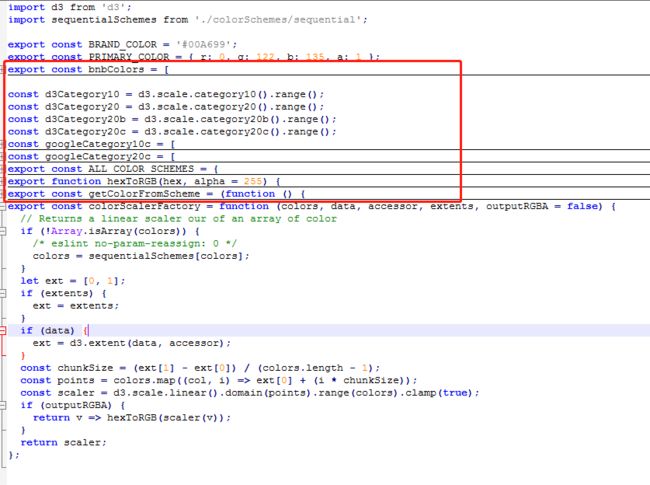
注意啊这里第二行import {getColorFromScheme} from ‘…/modules/colors’;是导入上级目录也就是src文件下的modules文件夹里的js,要确保你的目录正确,同时colors.js里有getColorFromScheme函数,(这个地方曾经困扰了我好久…因为我拷贝过来的echarts_funnel.js这行为import ‘…/javascripts/modules/colors’,然而我的安装目录下javascripts并没有color.js,这里应该是升级了0.28后目录有所改变)接下来需要修改colors.js,即superset/static/assets/src/modules目录下的color.js,代码如下
export const bnbColors = [
  '#ff5a5f', // rausch
  '#7b0051', // hackb
  '#007A87', // kazan
  '#00d1c1', // babu
  '#8ce071', // lima
  '#ffb400', // beach
  '#b4a76c', // barol
  '#ff8083',
  '#cc0086',
  '#00a1b3',
  '#00ffeb',
  '#bbedab',
  '#ffd266',
  '#cbc29a',
  '#ff3339',
  '#ff1ab1',
  '#005c66',
  '#00b3a5',
  '#55d12e',
  '#b37e00',
  '#988b4e',
];

const d3Category10 = d3.scale.category10().range();
const d3Category20 = d3.scale.category20().range();
const d3Category20b = d3.scale.category20b().range();
const d3Category20c = d3.scale.category20c().range();
const googleCategory10c = [
  '#3366cc',
  '#dc3912',
  '#ff9900',
  '#109618',
  '#990099',
  '#0099c6',
  '#dd4477',
  '#66aa00',
  '#b82e2e',
  '#316395',
];
const googleCategory20c = [
  '#3366cc',
  '#dc3912',
  '#ff9900',
  '#109618',
  '#990099',
  '#0099c6',
  '#dd4477',
  '#66aa00',
  '#b82e2e',
  '#316395',
  '#994499',
  '#22aa99',
  '#aaaa11',
  '#6633cc',
  '#e67300',
  '#8b0707',
  '#651067',
  '#329262',
  '#5574a6',
  '#3b3eac',
];
export const ALL_COLOR_SCHEMES = {
  bnbColors,
  d3Category10,
  d3Category20,
  d3Category20b,
  d3Category20c,
  googleCategory10c,
  googleCategory20c,
};
export function hexToRGB(hex, alpha = 255) {
  if (!hex) {
    return [0, 0, 0, alpha];
  }
  const r = parseInt(hex.slice(1, 3), 16);
  const g = parseInt(hex.slice(3, 5), 16);
  const b = parseInt(hex.slice(5, 7), 16);
  return [r, g, b, alpha];
}
export const getColorFromScheme = (function () {
  const seen = {};
  const forcedColors = {};
  return function (s, scheme, forcedColor) {
    if (!s) {
      return;
    }
    const selectedScheme = scheme ? ALL_COLOR_SCHEMES[scheme] : ALL_COLOR_SCHEMES.bnbColors;
    let stringifyS = String(s).toLowerCase();
    // next line is for superset series that should have the same color
    stringifyS = stringifyS.replace('---', '');

    if (forcedColor && !forcedColors[stringifyS]) {
      forcedColors[stringifyS] = forcedColor;
    }
    if (forcedColors[stringifyS]) {
      return forcedColors[stringifyS];
    }

    if (seen[selectedScheme] === undefined) {
      seen[selectedScheme] = {};
    }
    if (seen[selectedScheme][stringifyS] === undefined) {
      seen[selectedScheme][stringifyS] = Object.keys(seen[selectedScheme]).length;
    }
    /* eslint consistent-return: 0 */
    return selectedScheme[seen[selectedScheme][stringifyS] % selectedScheme.length];
  };
}());
-
修改superset/static/assets/src/visualizations/index.js文件,在export const VIZ_TYPES里加入
echarts_funnel: 'echarts_funnel',。
在const vizMap里加入[VIZ_TYPES.echarts_funnel]: () => loadVis(import(/* webpackChunkName: 'echarts_funnel' */ './echarts_funnel.js')),
index文件至关重要哦。要不然页面显示不出漏斗图的选项(记得图片、js命名不可以不一样哦) -
修改superset/static/assets/src/explore/visTypes.jsx文件,在export const visTypes下加如下代码(不要烦心哦,马上完事啦~坚持就是胜利)
  echarts_funnel: {
    label: t('Funnel View'),
    showOnExplore: true,
    controlPanelSections: [
      {
        label: t('Query'),
        expanded: true,
        controlSetRows: [
          ['metrics', 'groupby'],
          ['limit'],
        ],
      },
      {
        label: t('Chart Options'),
        controlSetRows: [
          ['color_scheme'],
        ],
      },
    ],
  },
- 恭喜来到最后一个文件,修改superset/viz.py 加入如下代码
class EchartFunnelBaseViz(BaseViz):

    viz_type = 'echarts_funnel'
    is_timeseries = False

    def get_data(self, df):
        fd = self.form_data
        metrics = fd.get('metrics')
        df = df.pivot_table(
            index=self.groupby,
            values=[metrics[0]]
        )
        df.sort_values(by=metrics[0], ascending=False, inplace=True)
        df = df.reset_index()
        df.columns = ['name', 'value']
        return df.to_dict(orient='records')
哈哈,还有一个文件,为了鼓励你们看到最后也是撒了个小慌,进入superset/static/assets/package.json文件,找到 一栏里添加
一栏里添加"echarts": "^3.8.5",,关闭文件。
编写完所有文件后在superset/static/assets下运行npm run dev 进行编译
欧了,大功告成,去运行吧,去造作吧,其他的图表都是一样的原理,O(∩_∩)O。
集成过程中遇到的错误
error1
ERROR in ./src/visualizations/index.js 85:19
Module parse failed: Unexpected token (85:19)
You may need an appropriate loader to handle this file type.
| var loadNvd3 = function () {
|   function loadNvd3() {
>     return loadVis(import( /* webpackChunkName: "nvd3_vis" */'./nvd3/adaptor.jsx'));
|   }
|
 @ ./src/modules/AnnotationTypes.js 17:22-50
 @ ./src/chart/chartAction.js
 @ ./src/explore/components/ExploreViewContainer.jsx
 @ ./src/explore/App.jsx
 @ ./src/explore/index.jsx
 @ multi babel-polyfill ./src/explore/index.jsx
解决方法:这是因为缺包哦,在superset/static/assets目录下运行npm install
![]()
error2
An error occurred while rendering the visualization: TypeError: (0 , o.getColorFromScheme) is not a function
解决方法:去看看你的echarts_funnel.js里面的getColorFromScheme函数,若是没有错误,找到它导入的文件modules下的colors.js有未定义的函数或变量没。
