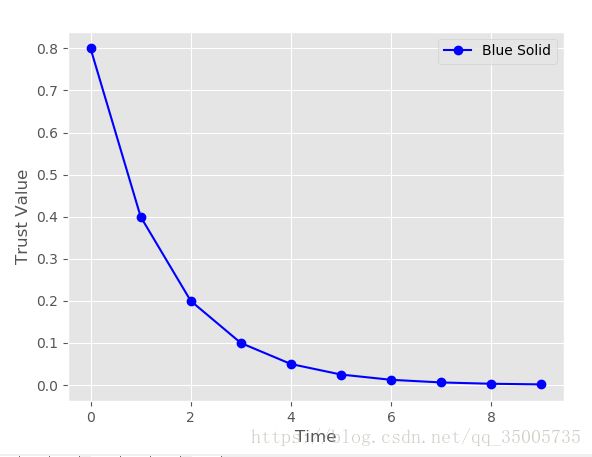
用Python画折线图
from numpy.random import randn
import matplotlib.pyplot as plt
plt.style.use('ggplot')
#输入Y1值,定义X1的范围
y1 = [0.8,0.4,0.2,0.1,0.05,0.025,0.0125,0.00625,0.0031,0.0016]
x1 = range(0,10)
fig = plt.figure()
ax1 = fig.add_subplot(1,1,1)
#每条折线都可以通过选项进行设置,使用不同的数据点类型、颜色和线型
ax1.plot(x1, y1, marker=r'o', color=u'blue', linestyle='-', label='Blue Solid')
ax1.xaxis.set_ticks_position('bottom')
ax1.yaxis.set_ticks_position('left')
#ax1.set_title('Line Plots: Markers, Colors, and Linestyles')
plt.legend(loc='best')
plt.savefig('line_plot.png', dpi=400, bbox_inches='tight')
import matplotlib.pyplot as plt
plt.style.use('ggplot')
#输入Y1值,定义X1的范围
y1 = [0.8,0.4,0.2,0.1,0.05,0.025,0.0125,0.00625,0.0031,0.0016]
x1 = range(0,10)
fig = plt.figure()
ax1 = fig.add_subplot(1,1,1)
#每条折线都可以通过选项进行设置,使用不同的数据点类型、颜色和线型
ax1.plot(x1, y1, marker=r'o', color=u'blue', linestyle='-', label='Blue Solid')
ax1.xaxis.set_ticks_position('bottom')
ax1.yaxis.set_ticks_position('left')
#ax1.set_title('Line Plots: Markers, Colors, and Linestyles')
#横坐标命名
plt.xlabel('Time')
#纵坐标命名
plt.ylabel('Trust Value')
#loc='best' 指示 matplotlib 根据图中的空白部分将图例
#放在最合适的位置。或者,你也可以使用这个参数为图例指定一个具体位置plt.legend(loc='best')
plt.savefig('line_plot.png', dpi=400, bbox_inches='tight')
plt.show()
