梯度下降法——python实现
梯度下降法——python实现
另一篇博客是随机梯度下降法的实现
In this homework, you will investigate multivariate linear regression using Gradient Descent and Stochastic Gradient Descent. You will also examine the relationship between the cost function, the convergence of gradient descent, overfitting problem, and the learning rate.
在本次作业中,你将探讨使用梯度下降法(随机梯度下降法)的多变量线性回归模型。你将探讨损失函数、梯度下降法的收敛、过拟合问题和学习率等之间的关系。
Download the file “dataForTraining.txt” in the attached files called “Homework 2”. This is a training dataset of apartment prices in Haizhu District, Guangzhou, Guangdong, China, where there are 50 training instances, one line per one instance, formatted in three columns separated with each other by a whitespace. The data in the first and the second columns are sizes of the apartments in square meters and the distances to the Double-Duck-Mountain Vocational Technical College in kilo-meters, respectively, while the data in the third are the corresponding prices in billion RMB. Please build a multivariate linear regression model with the training instances by script in any programming languages to predict the prices of the apartments. For evaluation purpose, please also download the file “dataForTesting.txt” (the same format as that in the file of training data) in the same folder.
请在文件夹“作业2”中下载文件名为“dataForTraining.txt”的文件。该文件包含广东省广州市海珠区的房价信息,里面包含50个训练样本数据。文件有三列,第一列对应房的面积(单位:平方米),第二列对应房子距离双鸭山职业技术学院的距离(单位:千米),第三列对应房子的销售价格(单位:万元)。每一行对应一个训练样本。请使用提供的50个训练样本来训练多变量回归模型以便进行房价预测,请用(随机)梯度下降法的多变量线性回归模型进行建模。为了评估训练效果,请文件夹中下载测试数据集“dataForTesting.txt” (该测试文件里的数据跟训练样本具有相同的格式,即第一列对应房子面积,第二列对应距离,第三列对应房子总价)。
Exercise 1:
题目
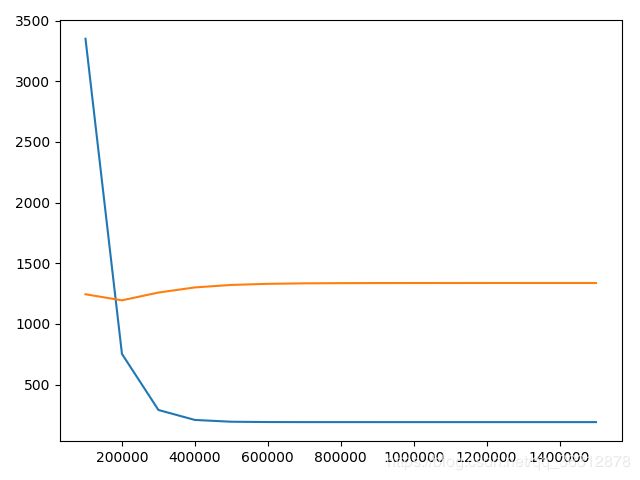
How many parameters do you use to tune this linear regression model? Please use Gradient Descent to obtain the optimal parameters. Before you train the model, please set the number of iterations to be 1500000, the learning rate to 0.00015, the initial values of all the parameters to 0.0. During training, at every 100000 iterations, i.e., 100000 , 200000,…, 1500000, report the current training error and the testing error in a figure (you can draw it by hands or by any software). What can you find in the plots? Please analyze the plots.
Exercise 1: 你需要用多少个参数来训练该线性回归模型?请使用梯度下降方法训练。训练时,请把迭代次数设成1500000,学习率设成0.00015,参数都设成0.0。在训练的过程中,每迭代100000步,计算训练样本对应的误差,和使用当前的参数得到的测试样本对应的误差。请画图显示迭代到达100000步、200000步、… … 1500000时对应的训练样本的误差和测试样本对应的误差(图可以手画,或者用工具画图)。从画出的图中,你发现什么?请简单分析。
答案
-
误差
迭代次数 训练集误差 测试机误差 100000 3350.439763530956 1244.6358567507064 200000 752.9741700253077 1194.5523365857432 300000 290.80670041460706 1258.7206255364906 400000 208.57316842851702 1300.964391608669 500000 193.94134289436053 1321.4839068994477 600000 191.33789983055019 1330.6198746479934 700000 190.87466878868773 1334.559078113643 800000 190.79224601511947 1336.2359151769367 900000 190.77758051780003 1336.9459412688884 1000000 190.7749710835127 1337.245924411146 1100000 190.77450678645073 1337.372548293513 1200000 190.77442417400073 1337.4259757329712 1300000 190.77440947475455 1337.4485150846626 1400000 190.77440685931563 1337.458023064512 1500000 190.7744063939496 1337.4620337845404 -
代码
import numpy as np
import matplotlib.pyplot as plt


def loss(train_data, weight, train_real):
    result = np.matmul(train_data, weight.T)
    loss = result - train_real
    losses = pow(loss, 2)
    losses = losses.T
    return losses.sum()


def gradient(train_data, weight, train_real):
    result = np.matmul(train_data, weight.T)
    loss = train_real - result
    # print (train_real)
    # print (result)
    # print (loss)
    x1 = train_data.T[0]
    x1 = x1.T
    gradient1 = loss * x1
    x2 = train_data.T[1]
    x2 = x2.T
    gradient2 = loss * x2
    x3 = train_data.T[2]
    x3 = x3.T
    gradient3 = loss * x3
    return gradient1.T.sum() / 50, gradient2.T.sum() / 50, gradient3.T.sum() / 50


filename = "./dataForTraining.txt"
filename1 = "./dataForTesting.txt"

# input the train data
read_file = open(filename)
lines = read_file.readlines()

list_all = []
list_raw = []
list_real = []
for line in lines:
    list1 = line.split()
    for one in list1:
        list_raw.append(float(one))
    list_all.append(list_raw[0:2])
    list_real.append(list_raw[2])
    list_raw = []

for one in list_all:
    one.append(1.0)

train_data = np.array(list_all)
train_real = np.array(list_real)
train_real = train_real.T

# input the test data
read_test = open(filename1)
test_lines = read_test.readlines()

list_all_test = []
list_raw_test = []
list_real_test = []
for test_line in test_lines:
    another_list = test_line.split()
    for one in another_list:
        list_raw_test.append(float(one))
    list_all_test.append(list_raw_test[0:2])
    list_real_test.append(list_raw_test[2])
    list_raw_test = []

for one in list_all_test:
    one.append(1.0)


train_test_data = np.array(list_all_test)
train_test_real = np.array(list_real_test)
train_test_real = train_test_real.T


# set the parameter
weight = np.array([0.0, 0.0, 0.0])
lr = 0.00015
x = []
y = []
z = []

for num in range(1, 1500001):
    losses = loss(train_data, weight, train_real)
    real_losses = loss(train_test_data, weight, train_test_real)
    gra1, gra2, gra3 = gradient(train_data, weight, train_real)
    gra = np.array([gra1, gra2, gra3])
    weight = weight + (gra * lr)
    # print (losses, real_losses)
    if num % 100000 == 0:
        x.append(num)
        y.append(losses)
        z.append(real_losses)
        print (losses, real_losses)

plt.plot(x, y)
plt.plot(x, z)
plt.show()
Exercise 2:
题目
Now, you change the learning rate to a number of different values, for instance, to 0.0002 (you may also change the number of iterations as well) and then train the model again. What can you find? Please conclude your findings.
Exercise 2: 现在,你改变学习率,比如把学习率改成0.0002(此时,你可以保持相同的迭代次数也可以改变迭代次数),然后训练该回归模型。你有什么发现?请简单分析。
答案
-
操作
由于从第一题的结果看,当lr为0.00015时,到达一定的次数之后会出现过拟合,因此需要调低一下学习率。因此本道题没有按照题目选择0.0002,而是选择了0.00003,以此来寻找最佳的拟合点。
-
误差
迭代次数 训练集误差 测试集误差 100000 12763.688614677096 1996.5022175657937 200000 9092.749685611183 1666.1554987348031 300000 6493.622143912071 1454.12970883651 400000 4653.367073328151 1322.4111037375815 500000 3350.414959405551 1244.634551279207 600000 2427.88838234995 1202.595415819055 700000 1774.7137366511224 1183.7935711665805 800000 1312.247799739428 1179.7061231510397 900000 984.8089681623431 1184.5742349763213 1000000 752.973107686592 1194.5524000926828 1100000 588.8268274679675 1207.1130324317212 1200000 472.6066652621286 1220.6307298687423 1300000 390.3195364574001 1234.0928269411381 1400000 332.05794536688643 1246.89858605016 1500000 290.80710765138787 1258.7204926660925 -
代码
import numpy as np
import matplotlib.pyplot as plt


def loss(train_data, weight, train_real):
    result = np.matmul(train_data, weight.T)
    loss = result - train_real
    losses = loss ** 2
    losses = losses.T
    return losses.sum()


def gradient(train_data, weight, train_real):
    result = np.matmul(train_data, weight.T)
    loss = train_real - result
    # print (train_real)
    # print (result)
    # print (loss)
    x1 = train_data.T[0]
    x1 = x1.T
    gradient1 = loss * x1
    x2 = train_data.T[1]
    x2 = x2.T
    gradient2 = loss * x2
    x3 = train_data.T[2]
    x3 = x3.T
    gradient3 = loss * x3
    return gradient1.T.sum() / 50, gradient2.T.sum() / 50, gradient3.T.sum() / 50


filename = "./dataForTraining.txt"
filename1 = "./dataForTesting.txt"

# input the train data
read_file = open(filename)
lines = read_file.readlines()

list_all = []
list_raw = []
list_real = []
for line in lines:
    list1 = line.split()
    for one in list1:
        list_raw.append(float(one))
    list_all.append(list_raw[0:2])
    list_real.append(list_raw[2])
    list_raw = []

for one in list_all:
    one.append(1.0)

train_data = np.array(list_all)
train_real = np.array(list_real)
train_real = train_real.T

# input the test data
read_test = open(filename1)
test_lines = read_test.readlines()

list_all_test = []
list_raw_test = []
list_real_test = []
for test_line in test_lines:
    another_list = test_line.split()
    for one in another_list:
        list_raw_test.append(float(one))
    list_all_test.append(list_raw_test[0:2])
    list_real_test.append(list_raw_test[2])
    list_raw_test = []

for one in list_all_test:
    one.append(1.0)

train_test_data = np.array(list_all_test)
train_test_real = np.array(list_real_test)
train_test_real = train_test_real.T


# set the parameter
weight = np.array([0.0, 0.0, 0.0])
lr = 0.00003
x = []
y = []
z = []

for num in range(1, 1500001):
    losses = loss(train_data, weight, train_real)
    real_losses = loss(train_test_data, weight, train_test_real)
    gra1, gra2, gra3 = gradient(train_data, weight, train_real)
    gra = np.array([gra1, gra2, gra3])
    weight = weight + (gra * lr)
    # print (losses, real_losses)
    if num % 100000 == 0:
        x.append(num)
        y.append(losses)
        z.append(real_losses)
        print (losses, real_losses)

plt.plot(x, y)
plt.plot(x, z)
plt.show()

